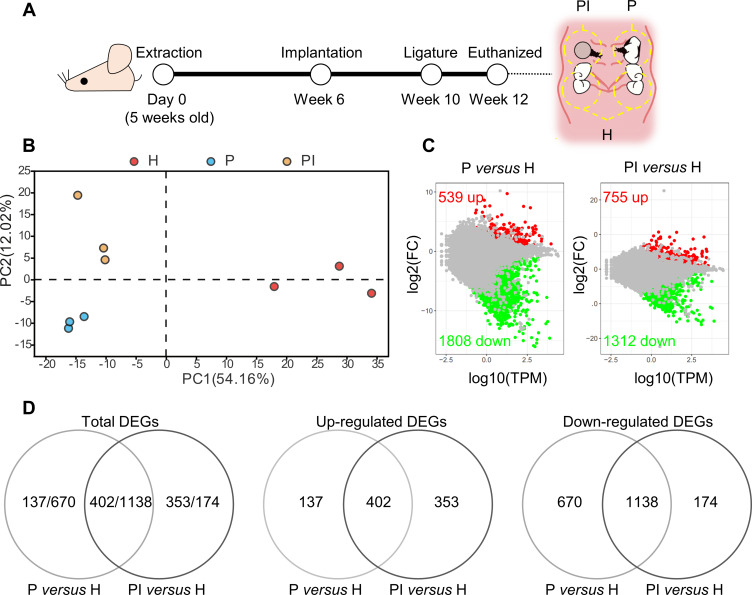
Figure 1.
Comprehensive analysis of differentially expressed genes (DEGs). (A) At week 10, silk ligatures were placed around the maxillary left first molars and right implants of mice. Soft tissues inside the yellow dotted line around the ligatured tooth (P), ligatured implant (PI) and third molar (H) sites were collected at week 12. (B) Principal component analysis of the three groups. The higher the variation in gene expression patterns across samples was, the greater the distance among samples. (C) Comparison of DEGs in each disease group versus the healthy control group using the MA plot. Red dots indicate significantly upregulated genes, green dots indicate significantly downregulated genes, and gray dots represent nonsignificantly differentially expressed genes. (D) Venn diagram. DEGs were identified as having a q value (adjusted p value) of ≤ 0.001 and |fold change| of ≥ 2.

