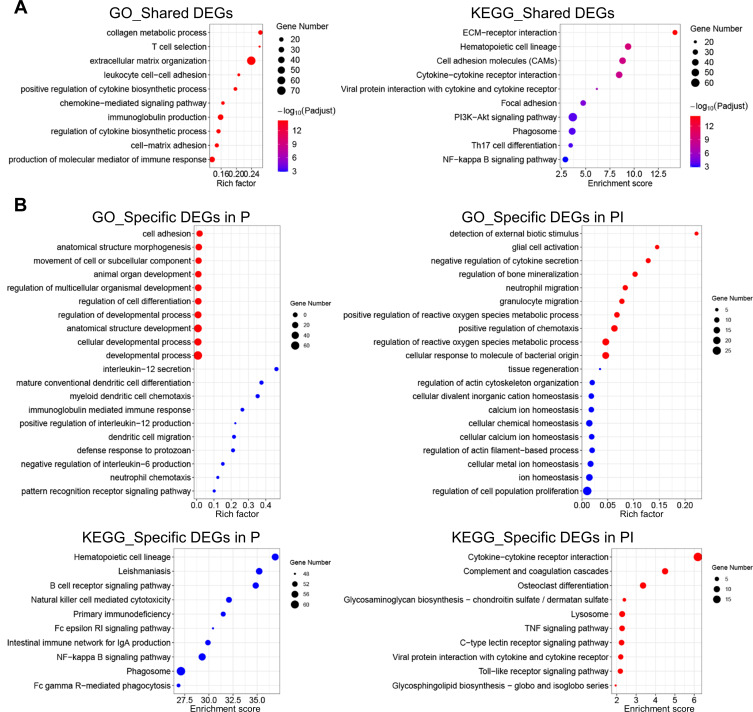
Figure 2.
GO and KEGG database enrichment analyses were used to determine the key pathways of the DEGs in peri-implantitis. (A) GO and KEGG enrichment analyses of the 1540 overlapping genes in both entities. (B) GO and KEGG enrichment analyses of the 1807 and 527 DEGs specific to periodontitis and peri-implantitis, respectively. Red dots represent the enriched items of the upregulated DEGs, and green dots represent the enriched items of the downregulated DEGs. Terms were considered enriched when p ≤ 0.001.

