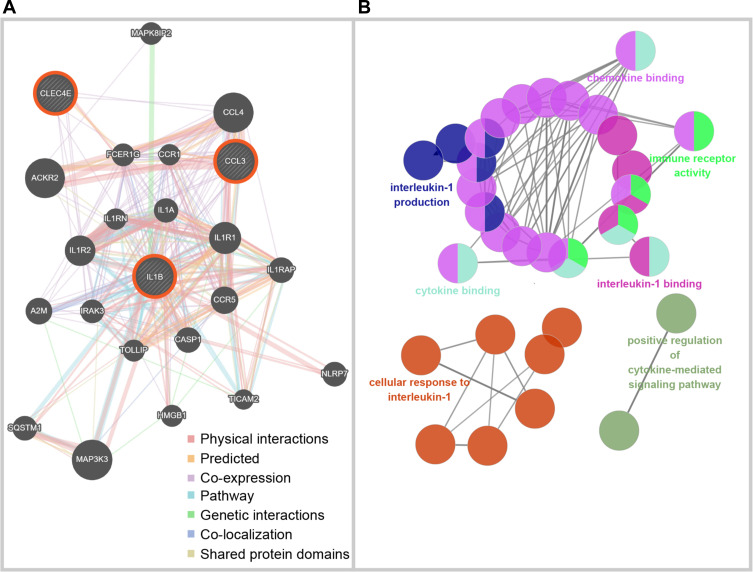
Figure 6.
Biological processes of selected core genes in peri-implantitis. (A) The network of three selected core genes and relevant genes built by GeneMANIA, where lines are color-coded based on the identities of the network names. (B) The biological process of core genes and relevant genes analyzed through ClueGO. The network of biological process terms is represented as pie charts, where pies are color-coded based on the identities of the terms.

