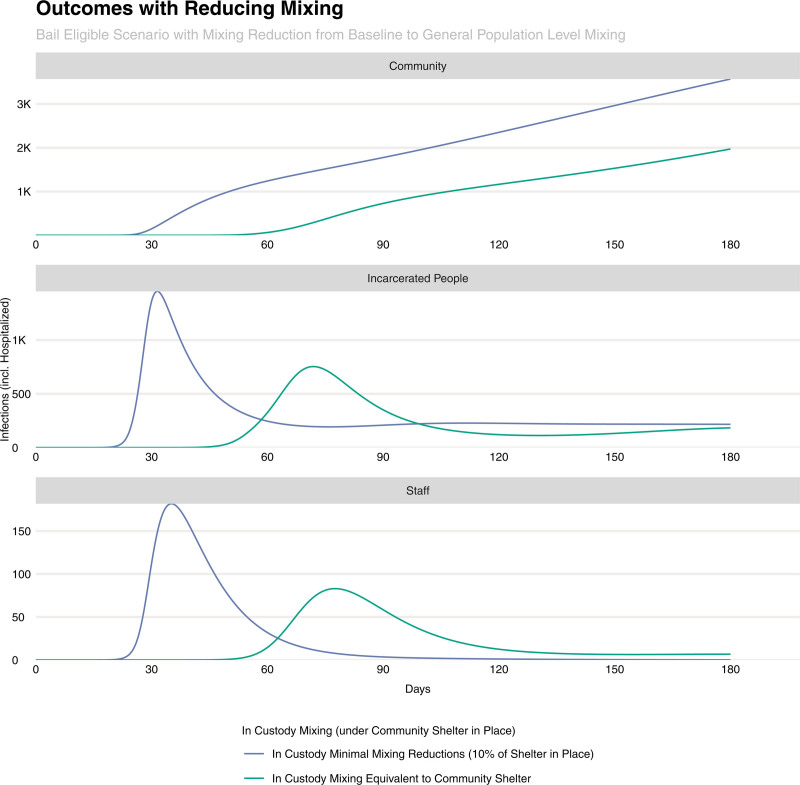
FIGURE 5.
Epidemic curves for the community (top panel), persons in jail (middle panel), and jail staff (bottom panel) under a shelter in place order as well as the deferment of bail-eligible persons. The curves show the impact of increased reduction in mixing (e.g., from the ability to physically distance persons in jail while in common areas) from baseline (dark blue) to identical to the community’s shelter-in-place order (green).

