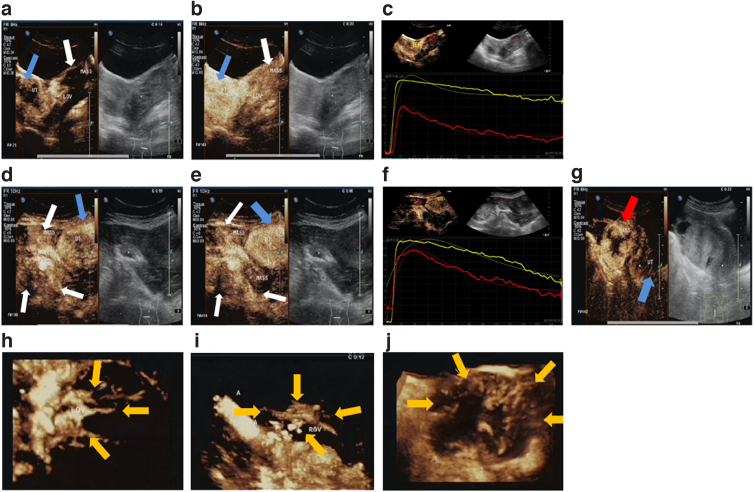
FIG. 2.
CEUS features of OSSPBT. (a–c) 2D-CEUS: the mass (white arrow) around the left ovary began to strengthen later than the uterine wall (blue arrow) (a), and the PI of the mass (white arrow) was lower than that of the uterine wall (blue arrow) (b). The contrast TIC curve of the lesion and myometrium (c) red is the lesion, yellow is the myometrium. (d–f) 2D-CEUS: the mass (white arrows) around the right ovary and the uterine wall (blue arrows) were in a synchronous low enhancement (d), and the regression rate was faster than that of the uterine wall (blue arrows) (e). The contrast TIC curve of the lesion and myometrium (f) red is the lesion, yellow is the myometrium. (g) The 2D-CEUS of MOSC (red arrow) showed that the centripetal enhancement was earlier than that of uterine wall (blue arrow). (h, i) 3D-CEUS: the trophoblastic vessels of the tumor originate from the left ovary and are radial branches (yellow arrows) (h). The tumor is supplied by large branching blood vessels around the right ovary (yellow arrows) (i). (j) The 3D-CEUS of MOSC showed irregular branches of nutrient vessels (yellow arrows) from the periphery to the center. 2D, two-dimensional; 3D, three-dimensional; CEUS, contrast-enhanced ultrasound; PI, peak intensity; TIC, time–intensity curve.

