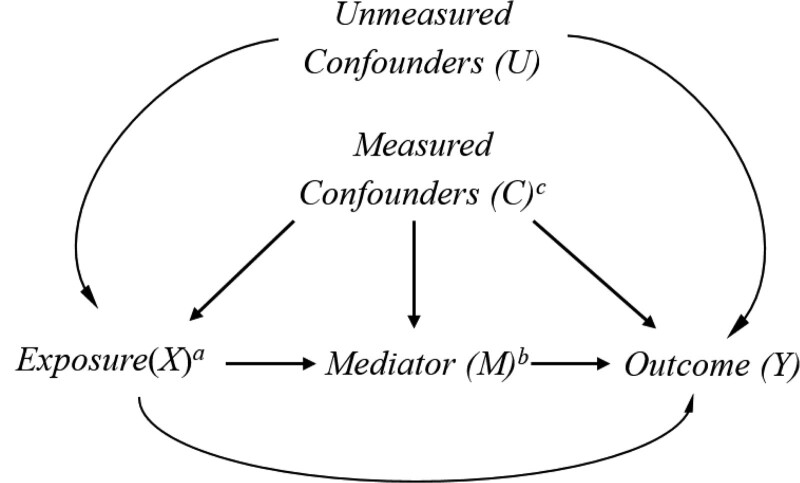
FIGURE.
Causal diagram for the plausible relations between chronic pain, opioid prescriptions, and mortality in the presence of measured and unmeasured confounders. aChronic pain (X) was self-reported and defined as reporting to have experienced pain for at least three months. bOpioids (M) include codeine, dihydrocodeine, meperidine, pentazocine, propoxyphene, tramadol, hydrocodone, morphine, tapentadol, fentanyl, hydromorphone, methadone, oxycodone, and oxymorphone. cMeasured covariates (C): Age, sex, race, education levels, poverty-income ratio, health insurance coverage, marital status, smoking, alcohol intake, and anti-depressant medication prescription. Illicit drug use was additionally adjusted for in a sensitivity analysis because the information was only available for participants aged 20-59 years. In the sensitivity analysis, we additionally adjusted for comorbidities such as cardiovascular diseases, cancer, and arthritis.

