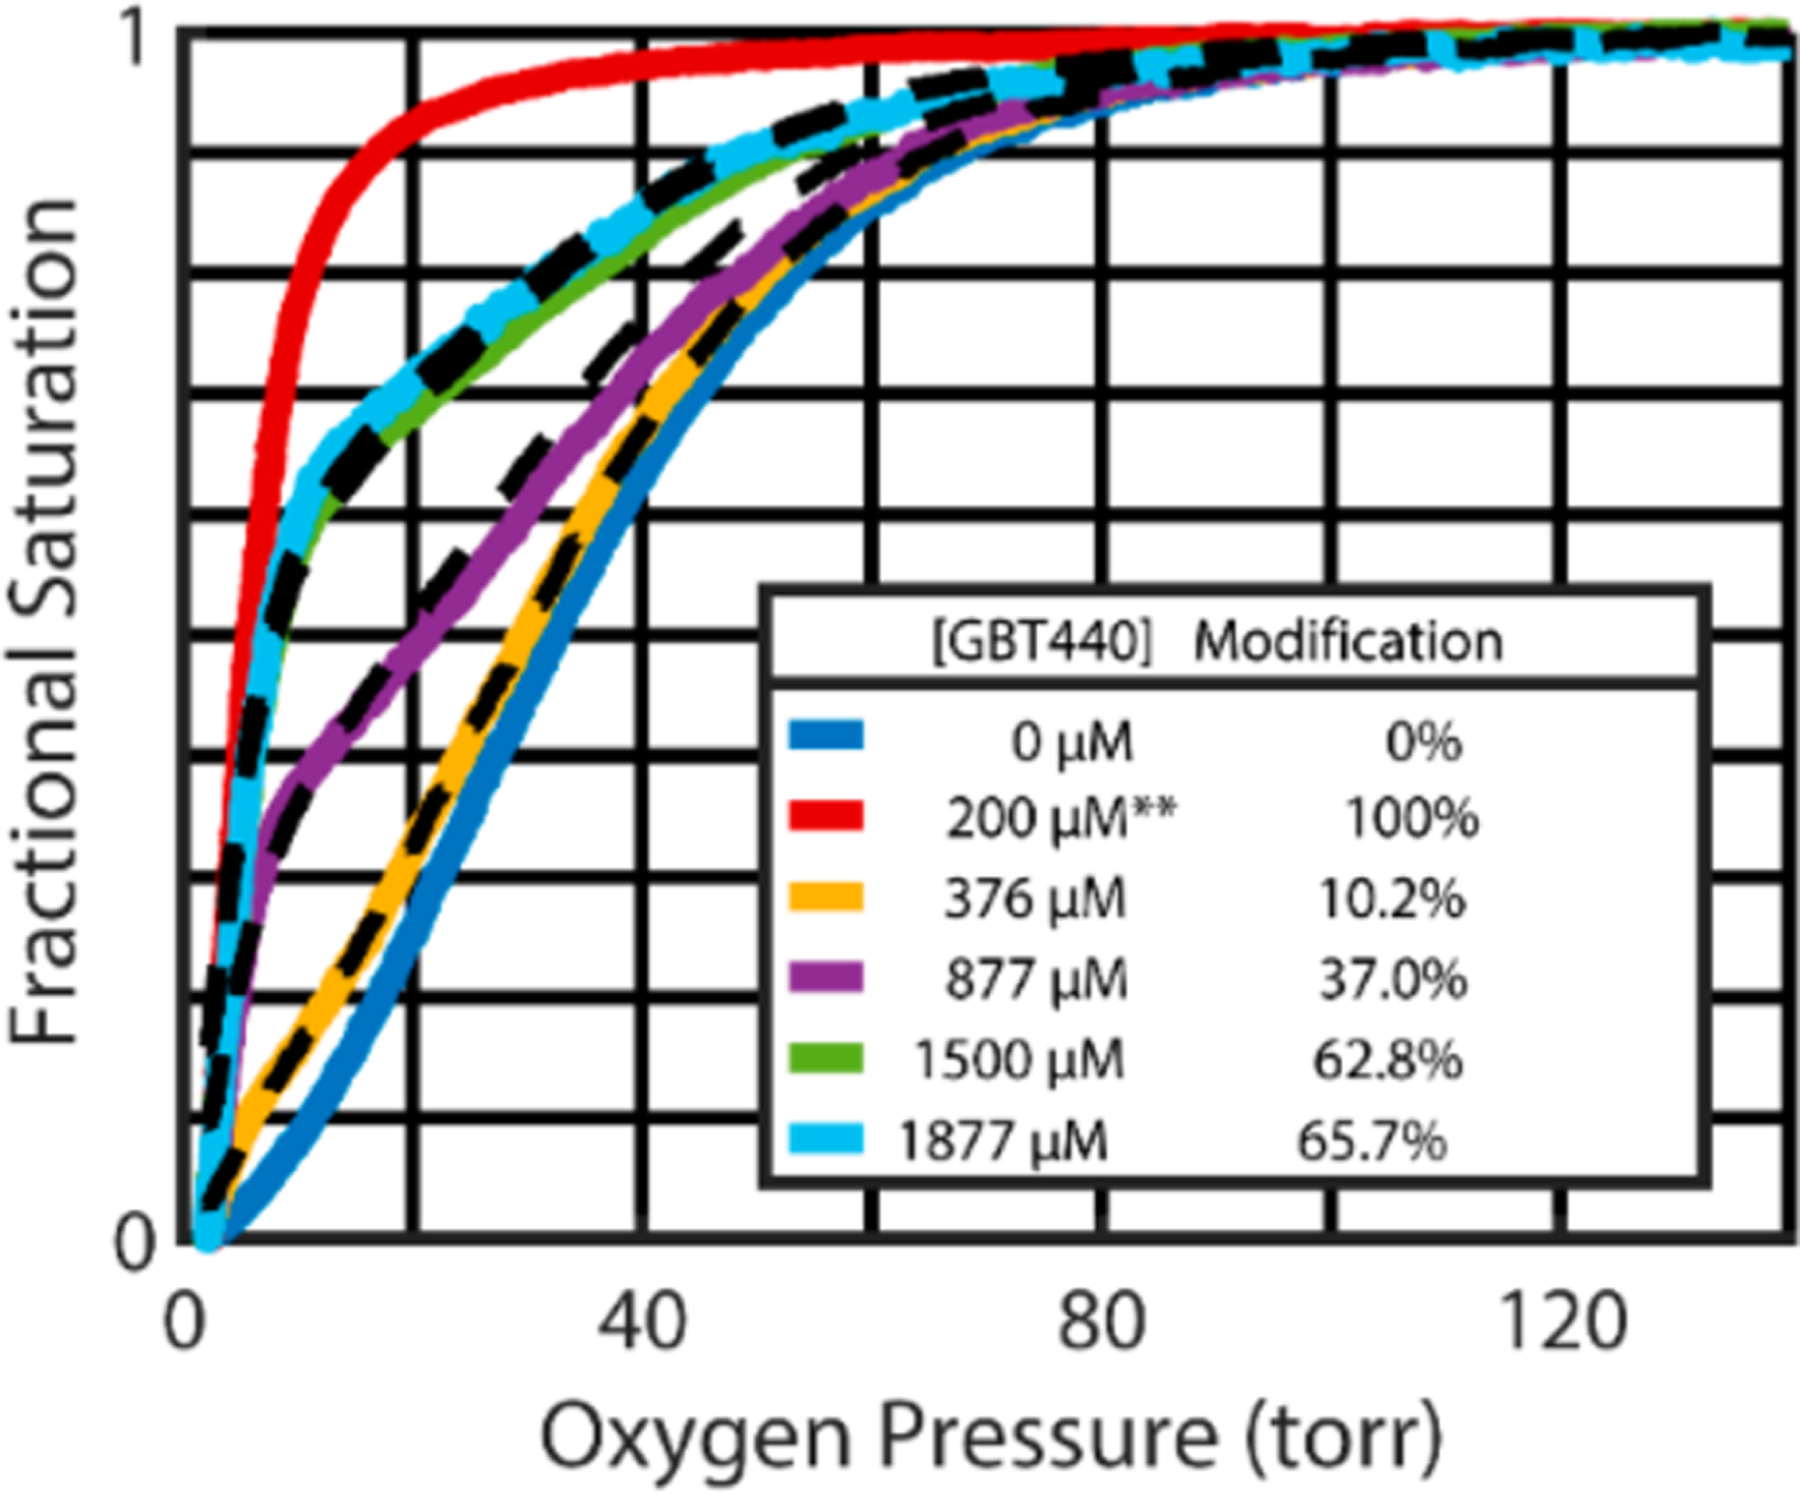
Figure 2.

Representative red cell oxygen dissociation curves (ODC) analyzed after incubating SS patient blood for 1 h at incrementally increasing GBT440 concentrations. These ODC curves, measured after a 50-fold dilution of whole blood into physiological buffer, show that the oxygen affinity increases in a dose dependent manner. Because dissociation of the drug from hemoglobin is so slow (hours), the suspending buffer for the ODC measurements contained no drug except for the red curve**, which contained sufficient GBT440 (200 μM) to saturate 100% of the Hb with the drug.12 At saturating concentrations, the R-T quaternary conformational equilibrium shifts completely to the noncooperative, high affinity oxygen dissociation curve of the R conformation. The black dashed curves show the optimal linear combination of the blue curve (absence of drug) and the red curve (saturating concentrations of drug) to yield the percent modified Hb. Additional data on the percent hemoglobin modified as a function of drug concentration is in Figure S1 of the Supporting Information.
