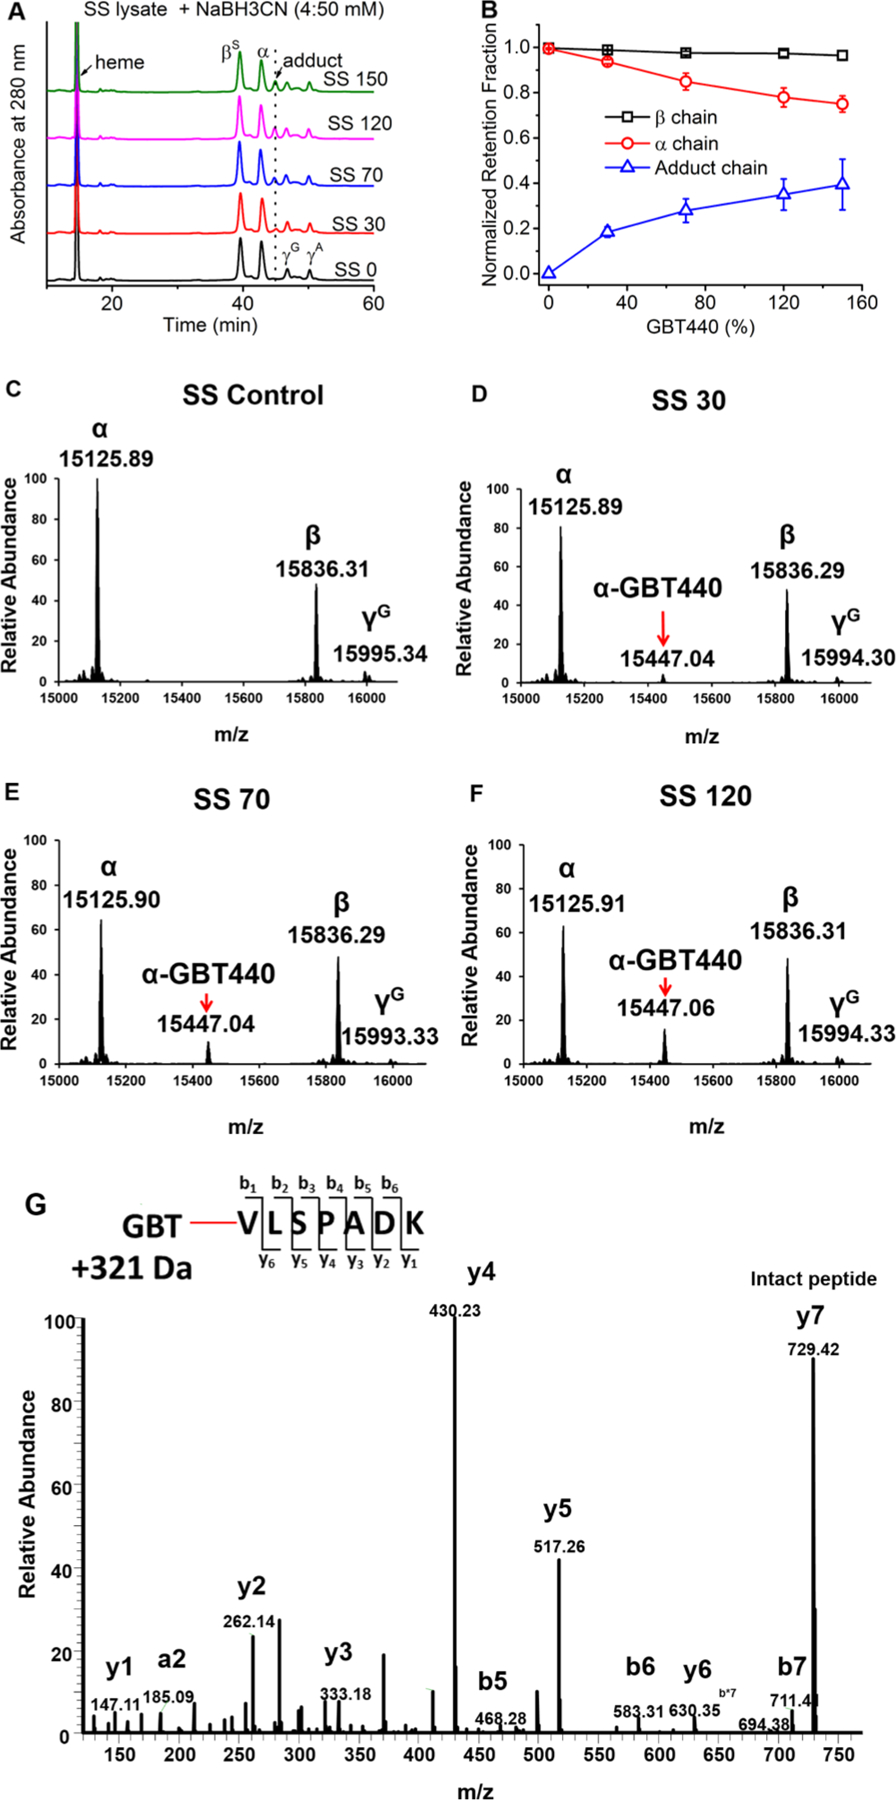
Figure 3.

(A) RP-HPLC analysis of SS lysate was performed after incubation with NaBH3CN. (B) The relationship of GBT levels and the retention fraction of subunit globins. The growing fractions of GBT-Hb adducts were also plotted in the figure (n = 3). The fractions of all the species were normalized by the globin chain area compared to the heme area (calculated from the Figure 3A). (C−F) Intact mass spectrometric analysis of Hb subunits from patient hemolysate (including control) treated with increasing dosages of GBT440. (G) LC/MS/MS fragmentation spectrum representing y and b fragment ions for the GBT440 labeled N-terminal α peptide. The GBT440 concentrations 30, 70, 120, and 150 correspond to % values of the 1 mM HbS tetramer (i.e., SS 30 contains 0.3 mM GBT440). These mass spectrometry data confirm that GBT440 labeling is specific to the α N-terminus.
