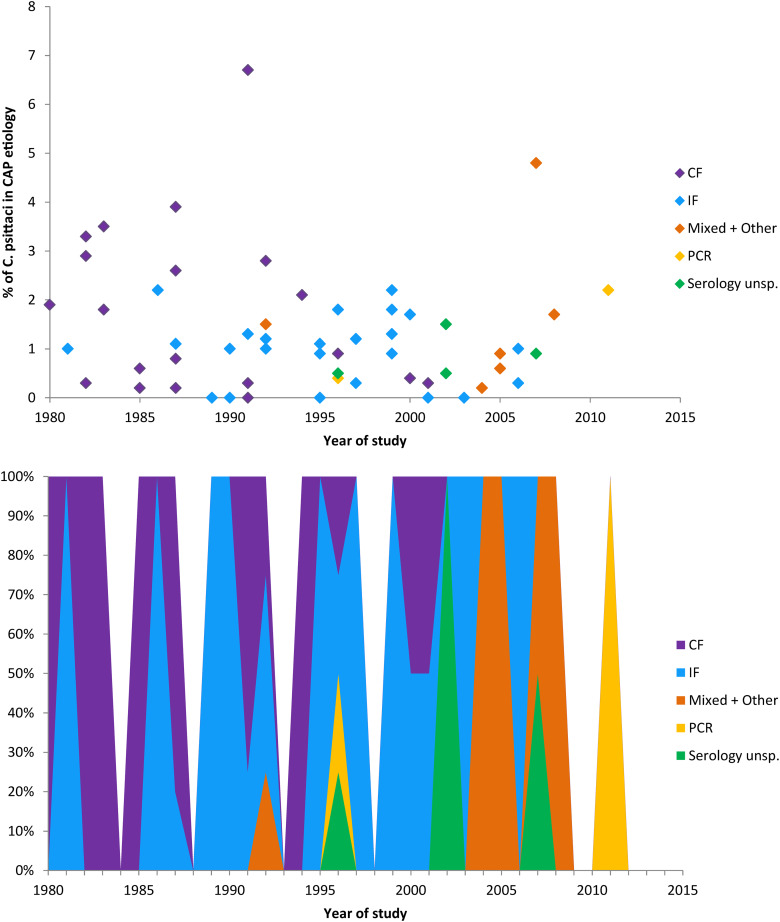
Fig. 3.
Proportion of CAP caused by Chlamydia psittaci in different studies over time and by type of laboratory diagnosis (top panel), and contribution of each type of laboratory diagnosis to the total over time (bottom panel). In the top panel, each symbol represents a study and the according percentage of CAP patients in which C. psittaci was found. The varying colours indicate the diagnostic methods that were used. CF, complement fixation test; IF, immunofluorescence test; ‘unsp.’, unspecified; PCR, polymerase chain reaction. In the bottom panel, the filled colours represent the contribution of each type of laboratory diagnosis to the total over time, expressed in percentages. ‘Year of study’ represents the year in which the gathering of data commenced. Although studies published before 1986 were not included, the period in which patient data had been gathered usually differed from the year of publication.

