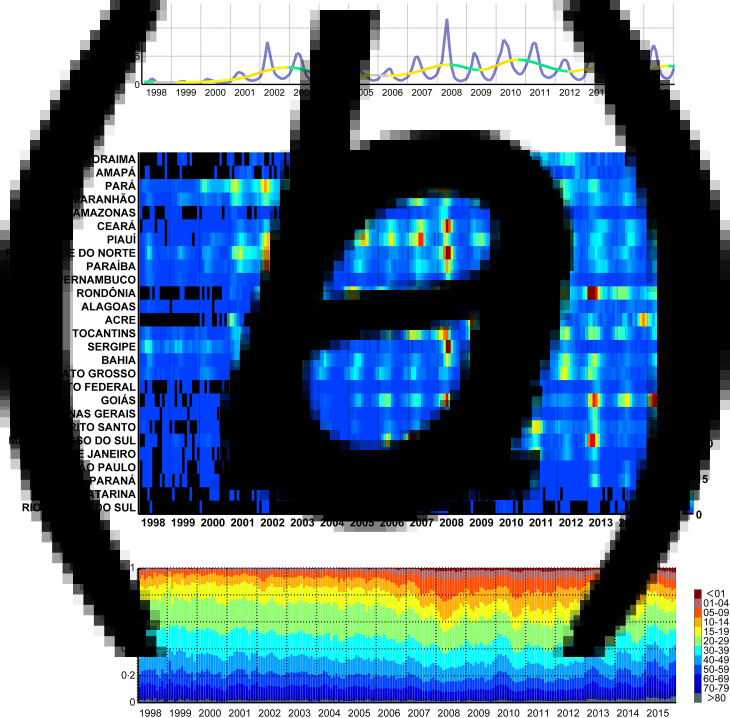
Fig. 2.
Monthly dengue hospitalisations in Brazil between 1998 and 2015. (a) Monthly incidence of hospitalisations (per 100 000 people) attributed to dengue in Brazil (purple line) and moving trend (warmer and colder colours highlight the rate of increase and decrease, respectively). (b) Monthly incidence per state per 100 000 people, sorted by the latitude of their capitals. (c) Proportion of hospitalisations per age group.

