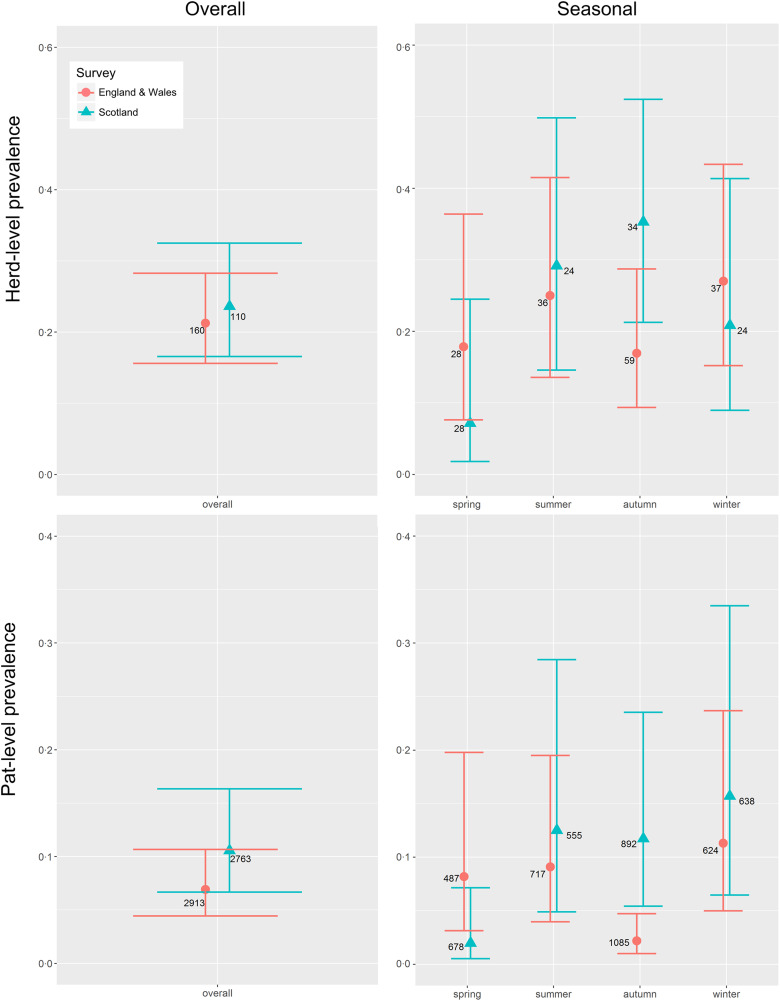
Fig. 1.
Mean seasonal prevalence estimates (solid triangles Scotland, solid dots England & Wales) including 95% CI (horizontal bars) for the herd-level and pat-level prevalence of Escherichia coli O157 in Scotland (blue) and in England & Wales (red) for farms sampled in Scotland (n = 110) and England & Wales (n = 160) between September 2014 and November 2015. Integer values beside each dot indicate the total number of farms or pats, as appropriate, sampled within each survey/season.

