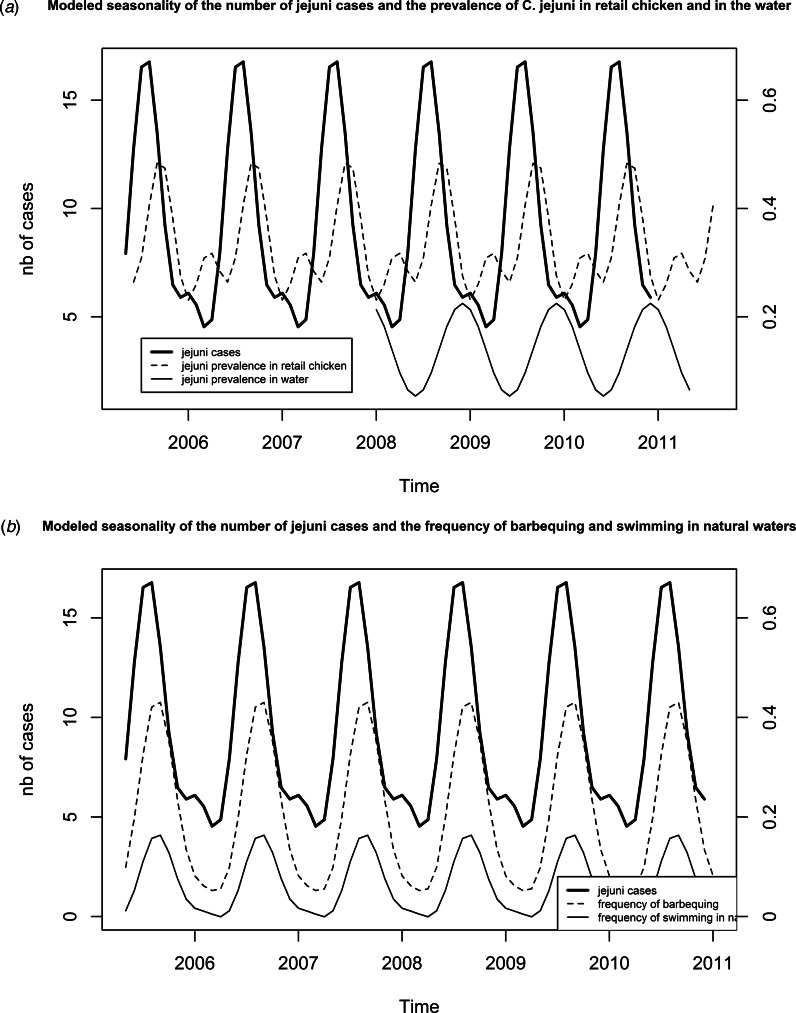
Fig. 4.
(a) Modelled seasonality through adjustment of a sinusoid to the data, for the number of C. jejuni cases (cos(2πt × 1/12) + sin(2πt × 1/12) + cos(2πt × 2/12) + sin(2πt × 2/12)), for the prevalence in chicken at retail (cos(2πt × 1/12) + sin(2πt × 1/12) + sin(2πt × 2/12)) and for the prevalence in water (sin(2πt × 1/12)). (b) Modelled seasonality through adjustment of a sinusoid to the data, for the number of C. jejuni cases (cos(2πt × 1/12) + sin(2πt × 1/12) + cos(2πt × 2/12) + sin(2πt × 2/12), for the frequency of barbequing (cos(2πt × 1/12) + sin(2πt × 1/12) + sin(2πt × 2/12)) and for the frequency of swimming in natural waters (cos(2πt × 1/12) + sin(2πt × 1/12) + sin(2πt × 2/12)).

