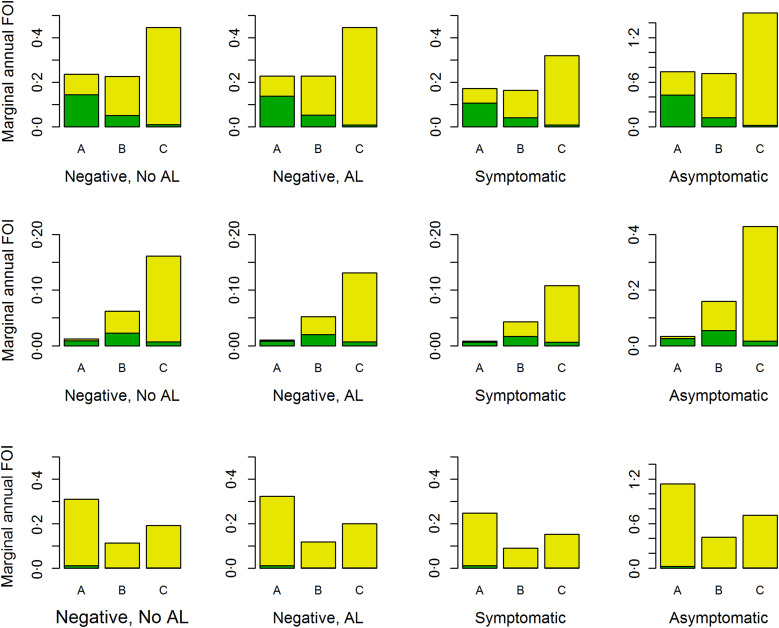
Fig. 3.
The lower bound (green) for the marginal annual FOI and the difference between upper and lower bound (yellow) with full bar showing the upper bound for the FOI, by study site, age group (A, <1 year; B, 1–4 years; and C, 5–10 years) and the infection status at the previous visit and past use of AL (negative and no AL in the past (left column), negative and AL in the past (second left column), symptomatic (second right column) and asymptomatic (right column)) for children assumed to be born in the baseline year (2001). Top row, Nagongera; middle row, Kihihi; bottom row, Walukuba.

