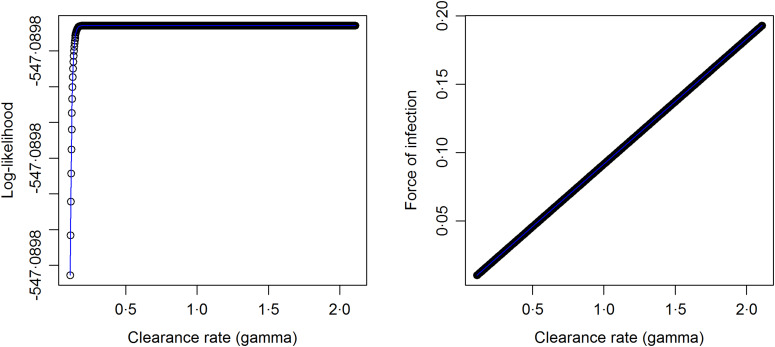
Fig. A1.
Plots for log-likelihood versus the clearance rate (left panel) and FOI versus the clearance rate (right panel) obtained after fitting 1000 models to the data according to π = λ/(λ + γ)(1 − e−(λ+γ)a) as given by Pull and Grab (1974) by choosing values for the annual clearance rate on a grid of 0·1 to 2·0 with a step size of 0·0019.

