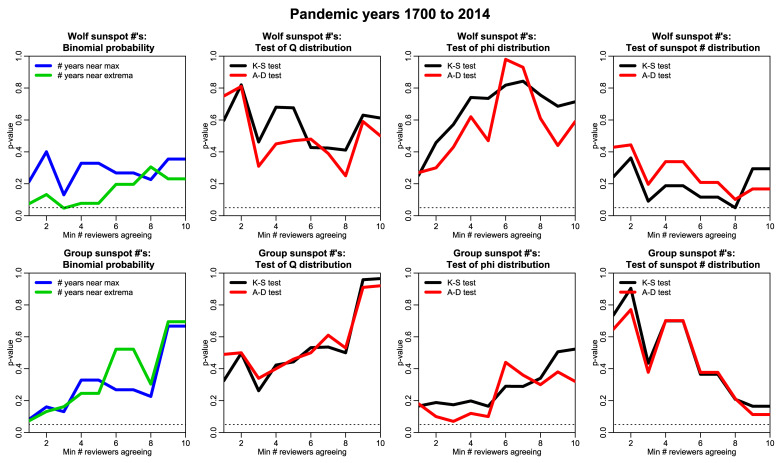
Fig. 2.
The results of the analyses of pandemic data as listed by Morens and Taubenberger, Mamelund, Lattanzi, Hampson and Mackenzie, Potter, Garrett, Beveridge, Kilbourne, Pyle, and Patterson [4–13], assessed using the Wolf and Group sunspot numbers (top row and bottom row of plots, respectively). The plots show the P-values assessed by the analyses, vs. the minimum number of reviewers agreeing that an outbreak or pandemic occurred. The first plot in the top and bottom rows shows the Binomial probability of the observed fraction of outbreak years within ±1 year of a maximum in sunspot activity, given the expected fraction for all years (and similarly for the years within ±1 year of an extremum in sunspot activity). The plots in the second, third, and fourth columns, respectively, show the re-creation of the Ertel, Tapping et al., and Yeung analyses [25–27], respectively, with the use of the Kolmogorov–Smirnov and Anderson–Darling tests to assess significance.

