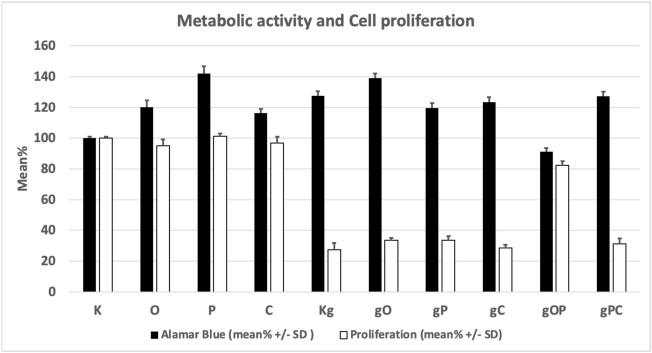
FIGURE 1.
Changes in the metabolic activity and proliferation of the studied cell groups under the influence of each treatment combination. K, control, non-treated HT29 cells; g, genomic deoxyribonucleic acid; Kg, gDNA-treated HT29 cells; O, ODN2088 CpG oligonucleotide; P, picropodophyllin; C, chloroquine; SD, standard deviation.

