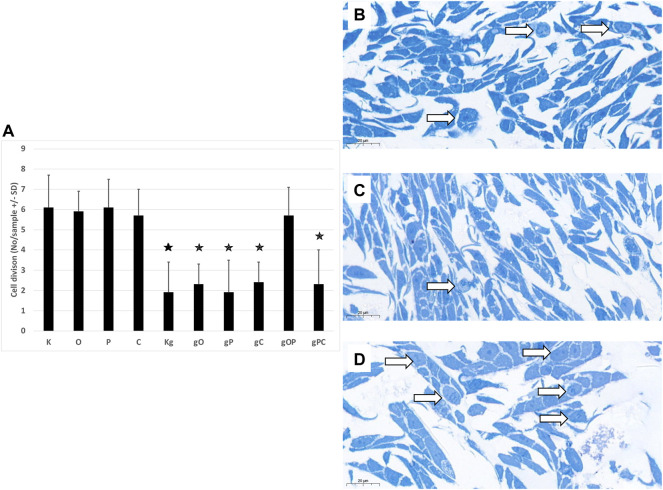
FIGURE 2.
Cell divisions in HT29 cells. (A) The graph indicates the average number of cell divisions per sample in the different treatment groups. The representative image inserts highlight the signs of cell division in HT29 cells. (B) Control, non-treated cells; (C) gDNA-treated control cells; (D): larger number of cell divisions in gOP sample. K, control, non-treated HT29 cells; O, ODN2088; P, picropodophyllin; C, chloroquine; Kg, genomic DNA control; g, genomic DNA; arrows indicate cell divisions; scale bar represents 20 μm; the presence of stars indicates significant differences from K (p < 0.05).

