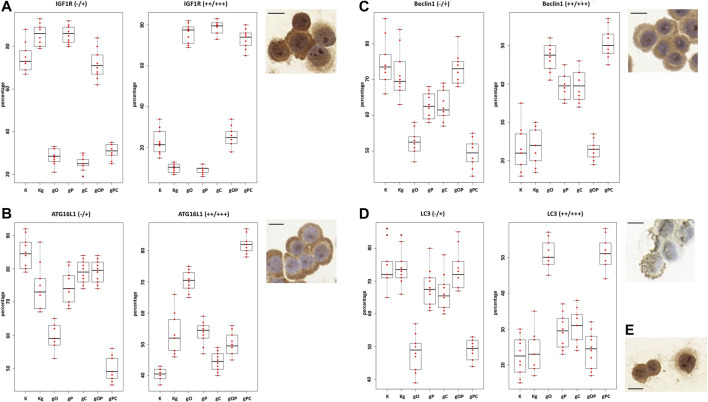
FIGURE 5.
One-way ANOVA results of IGF1R, ATG16L1, Beclin1, and LC3 immunocytochemistry analyses. The percentages of non-immunoreactive and weakly immunopositive (“−/+”), as well as moderately and strongly immunopositive (“++/+++“) HT29 cells within the treatment groups were plotted on box and whisker plots. (A) The boxplots for IGF1R. The right upper inserts represent the moderate to strong IGF1R immunopositivity (at ×200 magnification; the scale bar indicates 10 μm). The boxplots and representative immunostainings for ATG16L1 (B), Beclin1 (C), and LC3B (D) are also visualized. (E) Right lower insert represents CD133 positive HT29 cells (×200 magnification; the scale bar indicates 10 μm). K, control, non-treated HT29 cells; Kg, genomic DNA (gDNA) treated control; gO, gDNA + ODN2088; gP, gDNA + picropodophyllin; gC, gDNA + chloroquine; gOP, gDNA + ODN2088 + picropodophyllin; gPC, gDNA + picropodophyllin + chloroquine.

