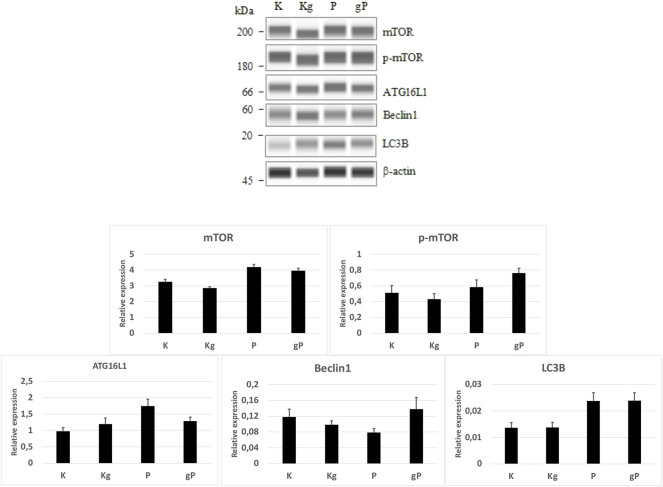
FIGURE 6.
WES Simple Western blot analyses of selected proteins. According to protein expression values normalized to β-actin (bar graphs), the mTOR and phospho-mTOR (p-mTOR) protein activities, as well as the autophagy-related protein (ATG16L1, Beclin1, LC3B) expressions were in relation to the gene expression results. K, control, non-treated HT29 cells; P, picropodophyllin; Kg, genomic DNA control; g, genomic DNA.

