Figure 3.
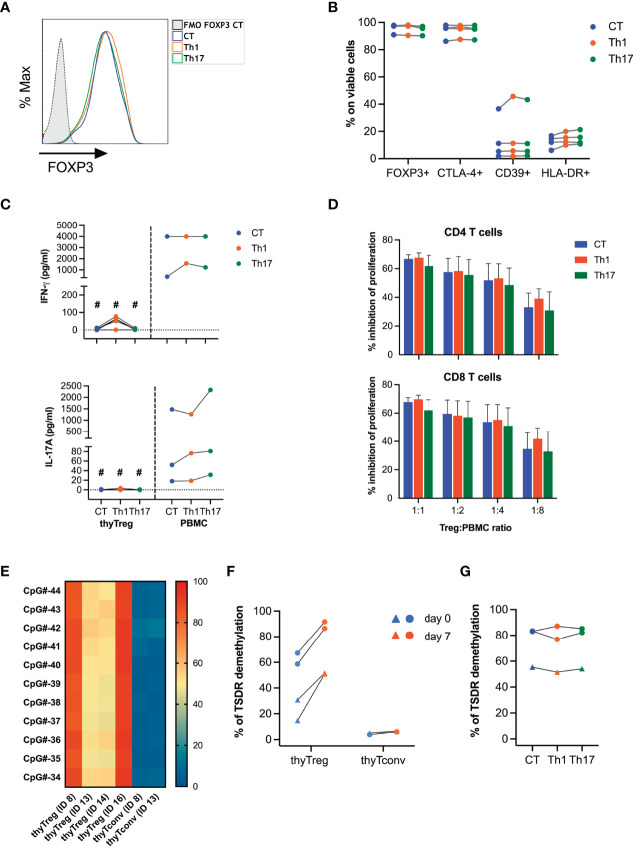
Stability of thyTreg cell product. (A–D, G) thyTreg cell product was restimulated under control conditions (CT, blue), or under Th1 (orange) or Th17 (green) polarizing conditions and evaluated after 3 days of culture. PBMC were cultured in parallel under the same conditions. (A) Representative flow cytometry histogram showing FOXP3 expression. To determine the background signal, the fluorescence minus one (FMO) of FOXP3 is shown. (B) Frequency of FOXP3, CTLA-4, CD39 and HLA-DR within thyTreg under different culture conditions. Paired Wilcoxon test showed no significant differences between conditions. (C) Quantitation of secreted IFN-γ and IL-17A by thyTreg or PBMC under different culture conditions. Comparison between culture conditions within the same cell type was performed using paired Wilcoxon test, and comparison within the same condition between thyTreg and PBMC were performed using unpaired Mann-Whitney test (#P < 0.05). (D) Summary (n=4) of the suppressive capacity of thyTreg cells cultured under different polarizing conditions defined as % inhibition of CD4 (upper panel) and CD8 T (lower panel) cell proliferation at the indicated ratios. Graphs show mean ± SEM. Paired Wilcoxon test showed no significant differences between conditions. (E) Demethylation level of 11 conserved CpGs at the TSDR region of FOXP3 in n=4 thyTreg cell products and n=2 thyTconv cultured in parallel for 7 days. ID13 and ID14 are female donors. (F) Global TSDR demethylation level (calculated as the mean of demethylation of the 11 CpGs) of thyTreg and ThyTconv right after cell isolation (day 0, blue) or after 7 days of culture (day 7, orange). Triangles represent female donors, and circles represent male donors. (G) Global TSDR demethylation level of thyTreg cultured under different polarizing conditions.

