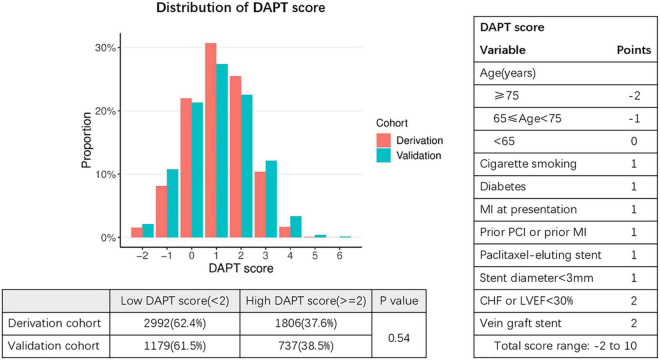
FIGURE 2.
Distribution of DAPT scores in the derivation and validation cohorts. Fisher exact test was used to compare distribution of patients with low DAPT score (< 2) and high DAPT score (≥ 2) in the derivation and validation cohorts. DAPT, dual antiplatelet therapy; MI, myocardial infarction; PCI, percutaneous coronary intervention; CHF, congestive heart failure; LVEF, left ventricular ejection fraction. The X-axis represents DAPT score, while the Y-axis represents proportion.

