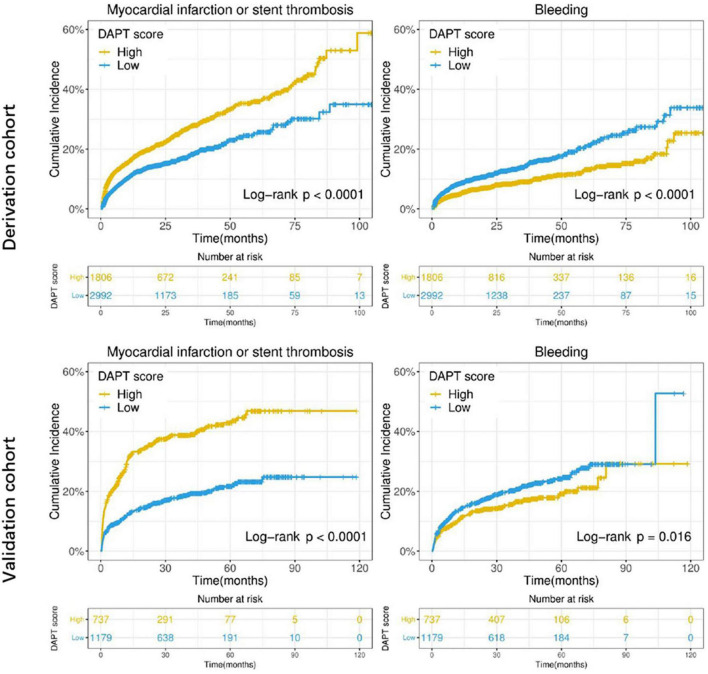
FIGURE 3.
Cumulative incidence of ischemic (myocardial infarction or stent thrombosis) and bleeding events stratified by high (≥ 2) vs. low (< 2) DAPT score in the derivation and validation cohorts. The X-axis represents time (month), while the Y-axis represents cumulative cadences. P < 0.05 was considered to indicate statistically significant differences.

