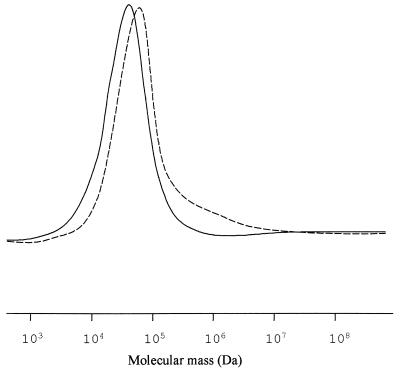
FIG. 4.
Molecular mass distribution of mcl-PHA produced by E. coli 193MC1. The PHA isolated from the cultures described in the legend to Fig. 3 were analyzed by GPC. Solid line, polymer produced in the presence of 1 mM 3-MB; dashed line, PHA isolated from cells induced with 0.25 mM 3-MB.

