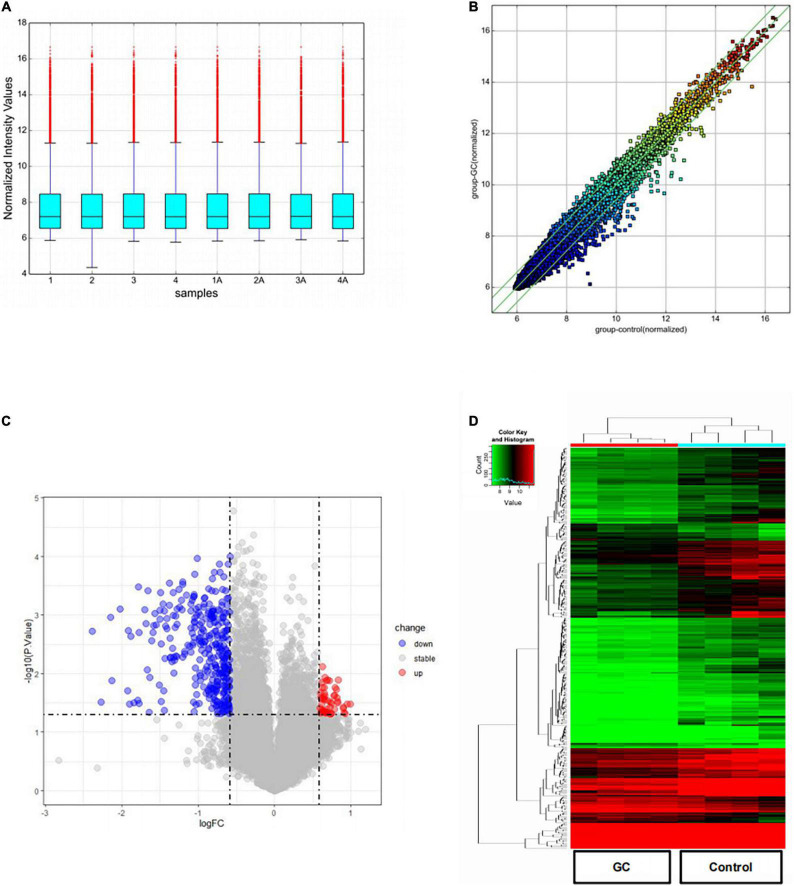
FIGURE 1.
DEcircRNAs in patients with vitiligo before and after systemic glucocorticoid therapy. (A) A box plot shows the distribution of expression data in each sample after quantile normalization. (B) Scatter plot was performed to evaluate the centralized tendency of chip data in two different groups. (C) Volcano plot of the P-value as a function of weighted fold change for DEcircRNAs (DEcircRNAs) (fold change > 1.5, P < 0.05). (D) Heat map for potential DEcircRNAs (n = 375) shows 51 upregulated and 324 downregulated.

