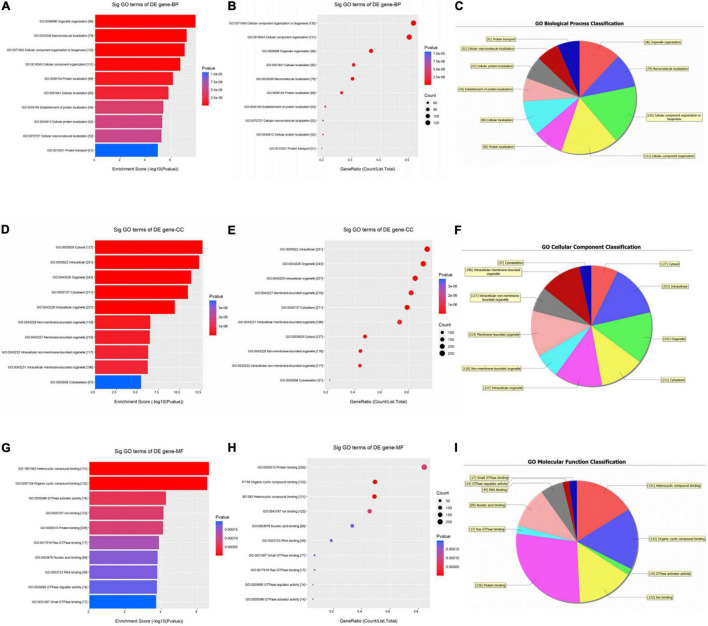
FIGURE 3.
Gene ontology (GO) enrichment analysis of downregulated circRNAs. For bubble plot, the y-axis shows the enriched terms in three GO categories and the x-axis shows the Enrichment Score [−log10(P-value)] or GeneRatio (Count/List. Total): (A,B) biological process, (D,E) cellular component, (G,H) molecular function. Pie chart shows the distribution of significantly GO terms: (C) biological process, (F) cellular component, (I) molecular function.

