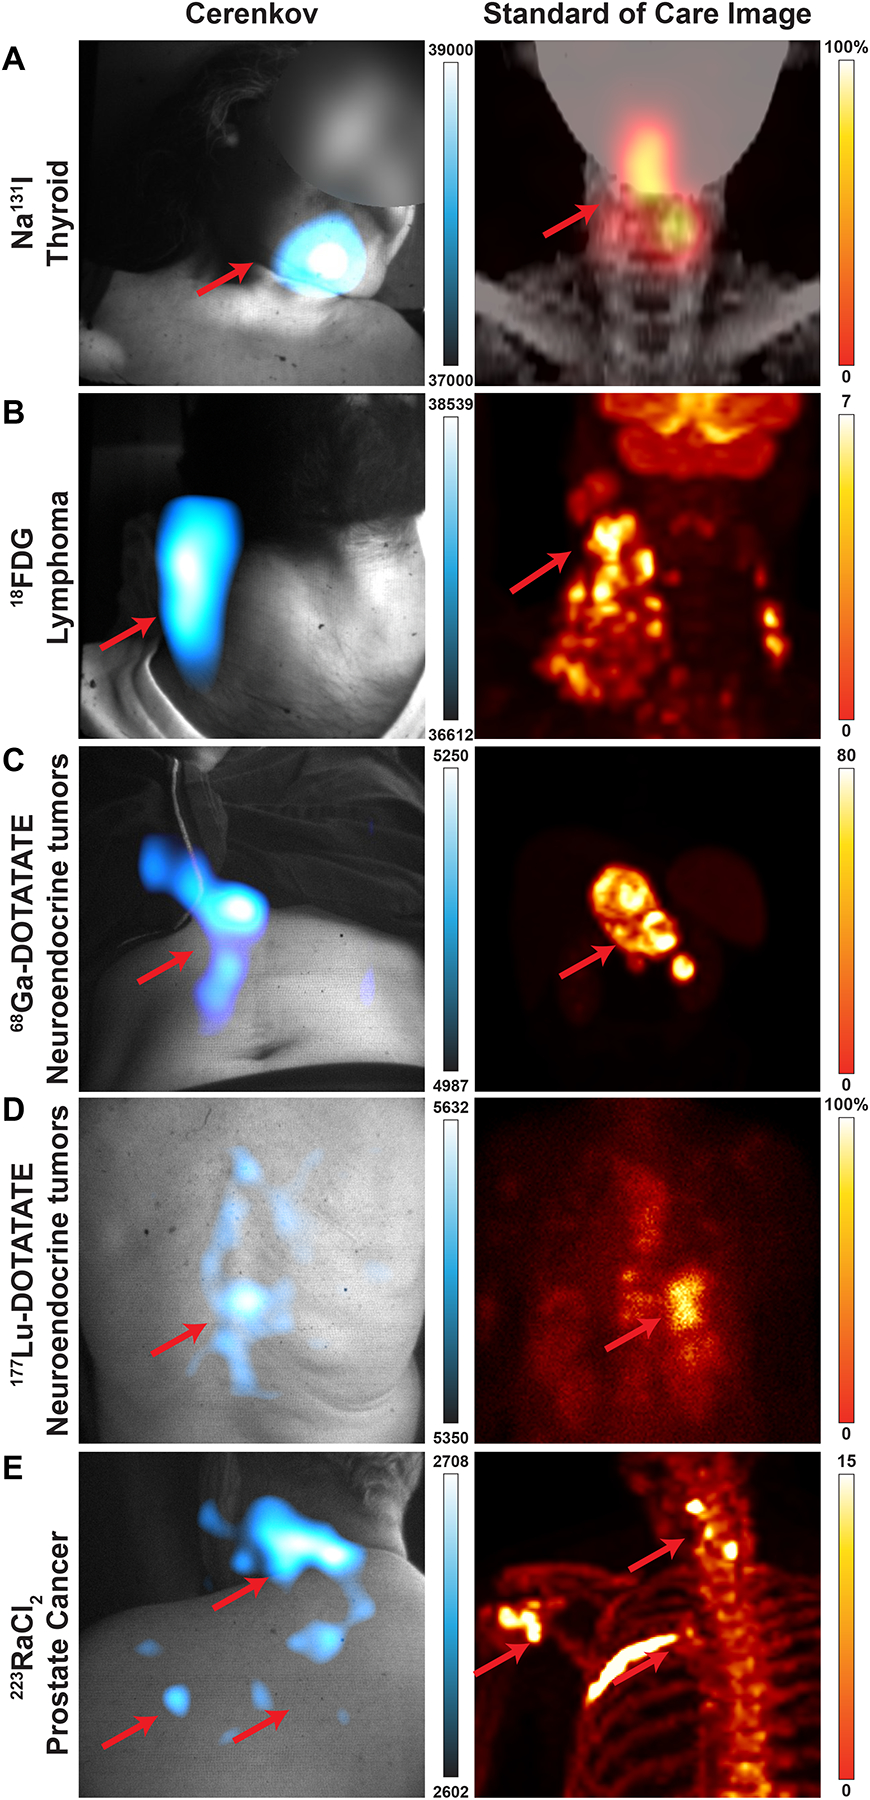
Fig. 2 |. Representative patients by isotope for fiberscope Cerenkov luminescence imaging.

Cerenkov luminescence images of the patients (left) compared to their standard-of-care PET or SPECT/planar scan (right). Brightest Cerenkov luminescence imaging regions align with the most avid regions. As Cerenkov luminescence imaging is optical, avid lesions overlaid by tissue will appear dimmer than similarly avid lesions closer to the surface. a, 38-year-old woman diagnosed with papillary thyroid cancer, tall cell variant, treated with total thyroidectomy and left lateral neck dissection underwent adjuvant 131I therapy. CL images were obtained after treatment with 144 mCi (5.3 GBq) of 131I, which showed radiopharmaceutical uptake in the thyroid bed. CL image, false colorized by Cyan Hot, shows focal uptake in the thyroid bed as seen on the SPECT scan. b, 33-year-old man diagnosed with classic Hodgkin’s lymphoma, nodular sclerosis type, in study for initial staging received ~12 mCi (0.4 GBq) of 18F-FDG. 18F-FDG PET/CT shows multiple hypermetabolic cervical, thoracic, and upper abdominal adenopathy. CLI identified a single large focal area in the right neck and displays as one region due to scattering of light and post-processing smoothing. Most avid disease in the right neck is seen in both CLI and PET maximum intensity projections (MIPs) in the mid neck, while less avid disease is seen down the right neck to the clavicle. c, 41-year-old woman diagnosed with well-differentiated pancreatic neuroendocrine tumour in study for consideration of PRRT. Baseline 68Ga-DOTATATE PET/CT delineates intense DOTATATE-avid upper abdominal adenopathy. CLI of the abdomen shows the most avid region is the tumour, though some artifacts on clothing were observed near the tumour and could be due to scattering, reflections, or patient movement. Furthermore, the presence of clothing and the rib cage likely attenuates or blocks CLI from the upper part of the lesion, leaving the central and lower part of the lesion to appear the brightest. From the angle imaged, the lesion appears on the right of the patient’s midline, though the PET image shows the lesion traverses the midline. d, 74-year-old woman diagnosed with well-differentiated small bowel neuroendocrine tumour metastatic to the liver, nodes, and spine on treatment with 177Lu-DOTATATE. After the first cycle of 177Lu-DOTATATE, 2D planar image shows radiopharmaceutical uptake in the liver and thoracic and abdominopelvic nodes, as well as the spine, while CLI from the posterior shows focal activity on the spine, which may mean the patient shifted slightly during imaging since the most avid lesion in the planar image is just right of the spine. e, 64-year-old man diagnosed with metastatic prostate cancer in the bone underwent treatment with 223Ra therapy, cycle four out of six. From prior 18F scans, radiopharmaceutical uptake was observed in the pelvic bone and fourth left rib, as well as degenerative lesions in the cervical spine. CL was focused on the degenerative lesions in the cervical spine from a posterior position. CLI was also observed in the shoulder and posterior left 4th rib. CLI from the posterior rib was not likely seen due to the overlaid scapula and rhomboid muscle which would attenuate CL. Here, CL could directly image 223Ra uptake without a subsequent 18F bone scan or rely on the 1% gamma emissions from 223Ra31. As with 223Ra and 18F imaging, physiologic distribution and degenerative lesion uptake complicates a potential diagnosis by imaging alone. Colour bars: CLI image intensity represents 16-bit grey value range, for a, SPECT image is scaled to 100% and d, 2D planar image is scaled to 100% of maximum image count. Standard of care images b, c, and e PET images are presented as maximum intensity projections and scaled to 0–7, 0–80, and 0–15 SUV, respectively.
