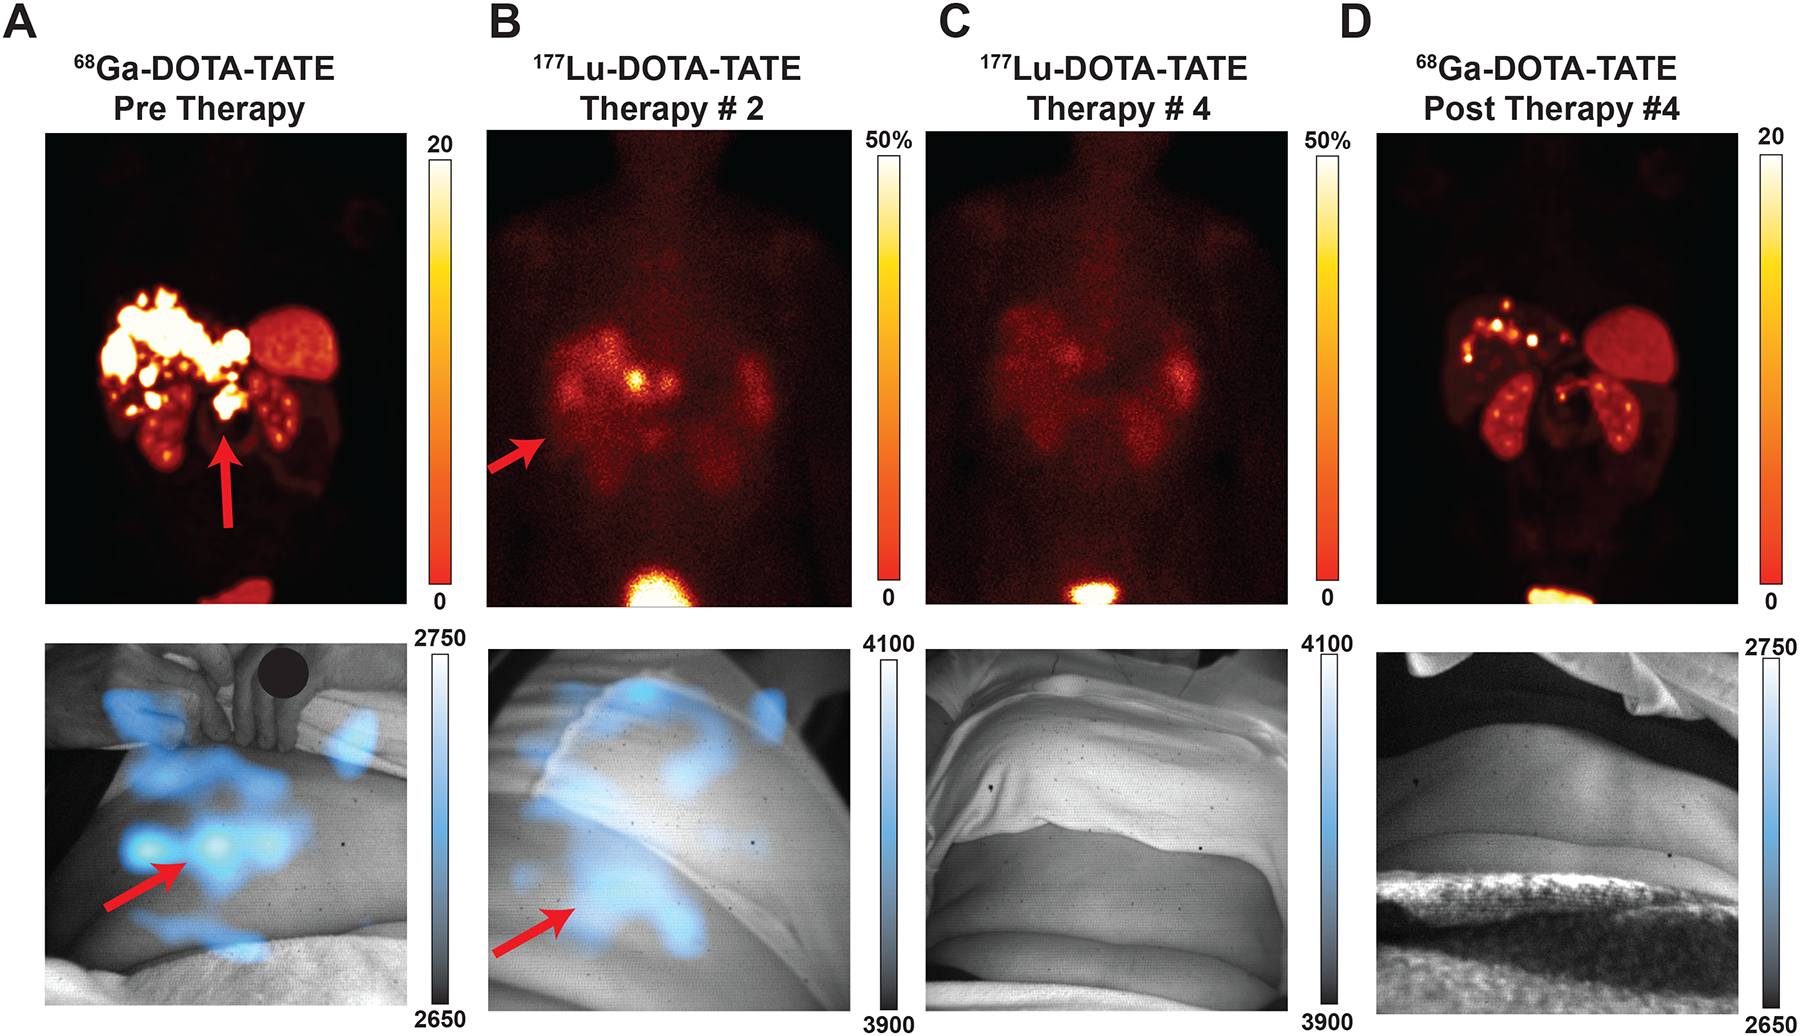
Fig. 4 |. CLI for monitoring therapy over successive imaging sessions.

All images presented with the initial CLI image intensity range for the given radiotracer. Min/max values can be found in Extended Data Fig. 5 for more precise disease monitoring. Intensities reported as the following: PET reported as SUV; planar SPECT and CL represented as pixel intensity. A 58-year-old woman diagnosed with well-differentiated pancreatic neuroendocrine tumour metastatic to the liver, on treatment with 177Lu-DOTATATE peptide receptor radionuclide therapy (PRRT). Baseline 68Ga-DOTATATE PET/CT (Top Left) Fused PET/CT coronal orientation delineates DOTATATE-avid tumour in the pancreatic body and multiple liver metastases. CLI of the patient immediately post PET/CT scan (a Bottom) shows a central abdominal lesion with scattering from liver metastases which are occluded in the liver and partially under the rib cage. After the first cycle of PRRT, a 2D planar image (b Top) shows the 177Lu-DOTATATE uptake within the liver and pancreatic tumour. CL image of the abdomen, albeit at a different angle as the operator moves the fiberscope into place and patients can sit down differently, correlates 177Lu-DOTATATE in the liver (b Bottom). After the third cycle of PRRT, the 2D planar image (c Top) shows marked reduction in radiopharmaceutical uptake in the pancreas and liver. Corresponding CL image (c Bottom) shows no clear CL signal when set to the intensity in b. At completion of the PRRT cycles, a diagnostic scan with 68Ga-DOTATATE PET/CT (d Top) delineates a marked reduction in DOTATATE uptake with the pancreatic tumour and resolved uptake in the liver metastases. CLI of the patient post-PET/CT (d Bottom) windowed to the initial diagnostic scan a shows no appreciable CL signal. Comparing initial DOTATATE scans to subsequent images through one year of therapy, patient disease burden has significantly resolved (Top) and Cerenkov images show a reduction in radiotracer present as well, corroborating disease reduction. Subsequent images are matched to prior CL images for distance, acquisition time, binning, with projection matches as best as possible whilst ensuring patient comfort. Colour bars: CLI image intensity represents 16-bit grey value range, for a, and d, PET images are presented as maximum intensity projections and scaled to 0–20 SUV, while for b, and c, 2D planar images are shown representing 50% maximum intensity (bladder).
