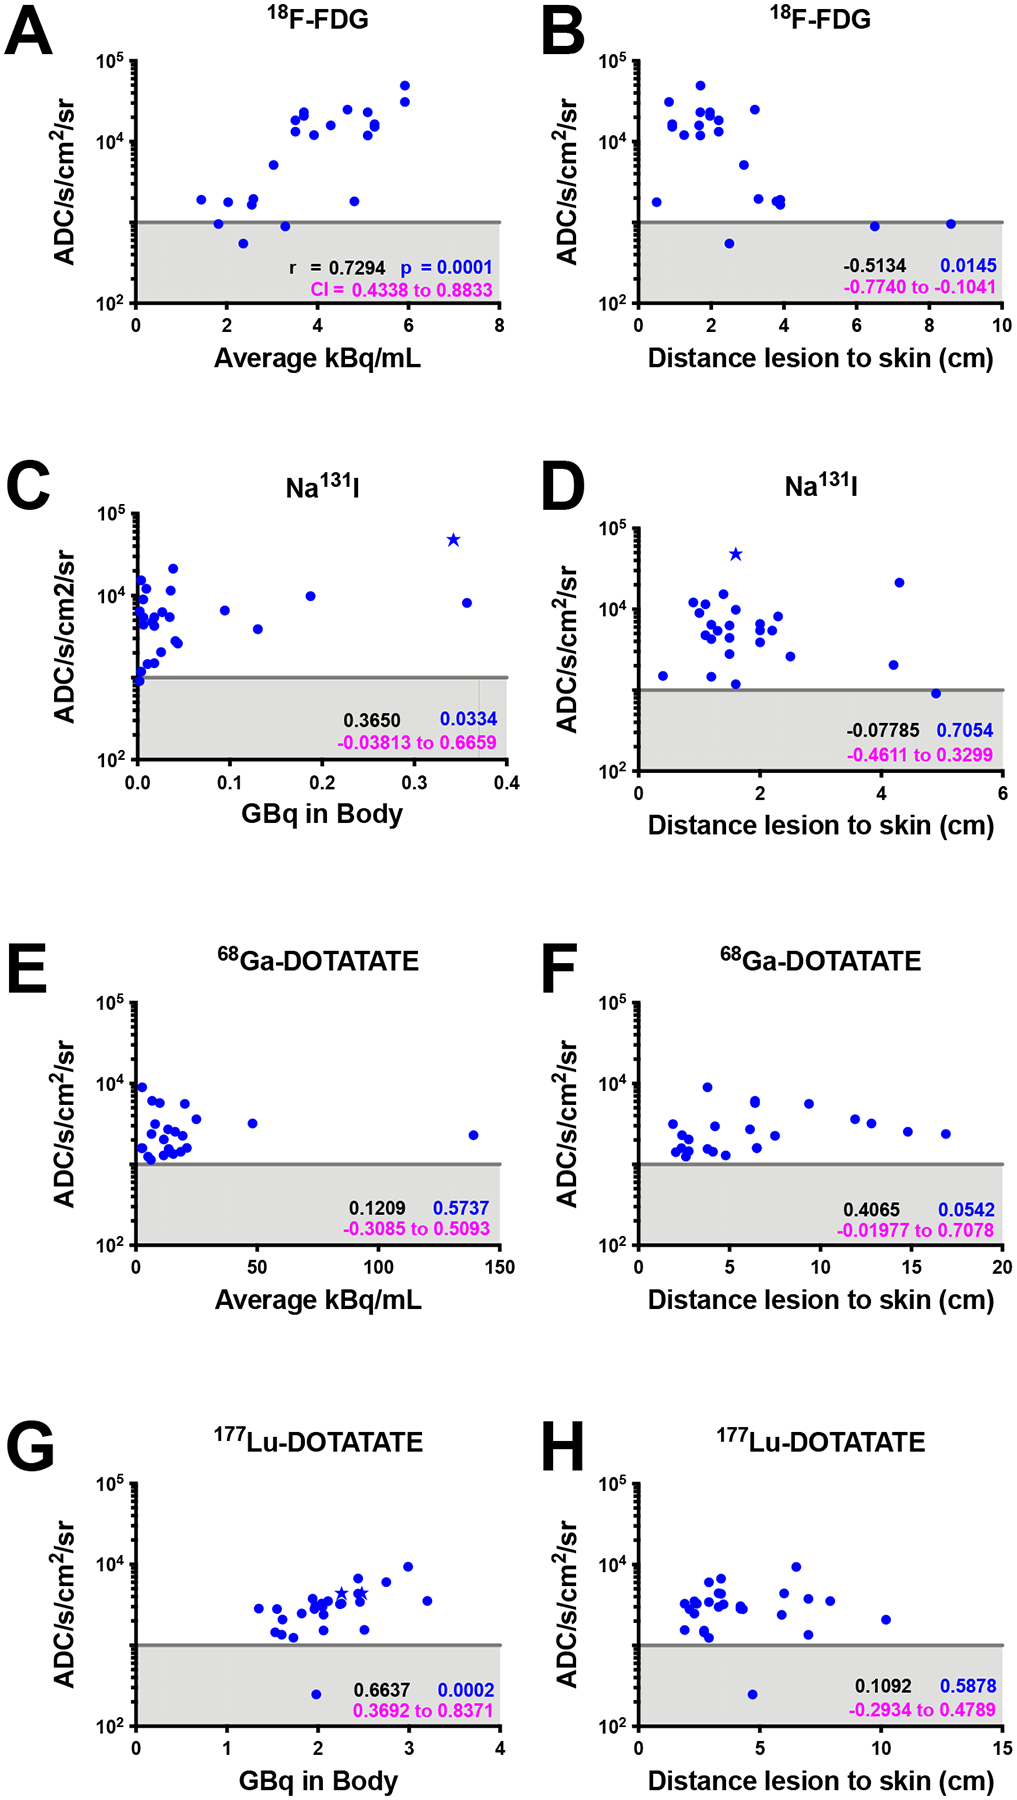
Fig. 5 |. CL intensity analysis of patient images correlated with the same-day, standard-of-care scan activity concentration or mCi in body or lesion depth as determined by CT.

CL units in analogue to digital counts (ADC) s−1 cm−2 sr−1. Gray line represents the apparent limit of detection based upon the dark charge of the camera sensor, scattering and absorption of light, and the fiberscope optics. Star-shaped datapoints represent Black or African American patients. Spearman correlations in a, b, c, and g are significant whereas others did not achieve significance for the patients imaged. a-h, Spearman r values are in black, CI values in magenta, and P-values in blue.
