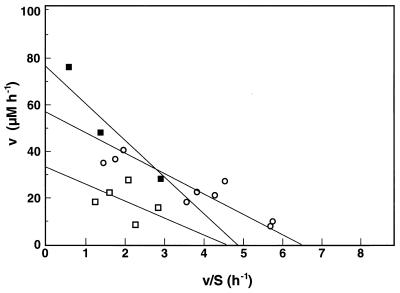
FIG. 3.
Eadie-Hofstee single-reciprocal plot of cysteate (squares) and taurine (circles) consumption kinetics. Solid symbols, cell suspension data; open symbols data from slurry experiments. All measurements were obtained with stromatolite samples (the same samples used for the experiments whose results are shown in Fig. 1 and 2). The slope is defined by −Km.

