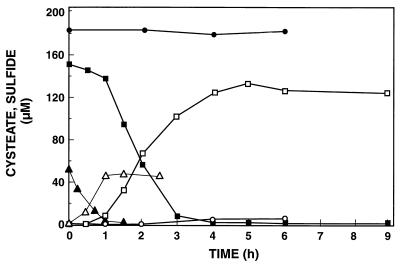
FIG. 4.
Time course of cysteate consumption and sulfide production in a cell suspension from an enrichment culture from a Bahamian stromatolite. Solid symbols, cysteate; open symbols, sulfide; circles, control (chemical destruction of cysteate when 184 μM cysteate was added); squares and triangles, microbial consumption of 154 and 52 μM cysteate, respectively. The results obtained when 18 μM cysteate was added are not shown.

