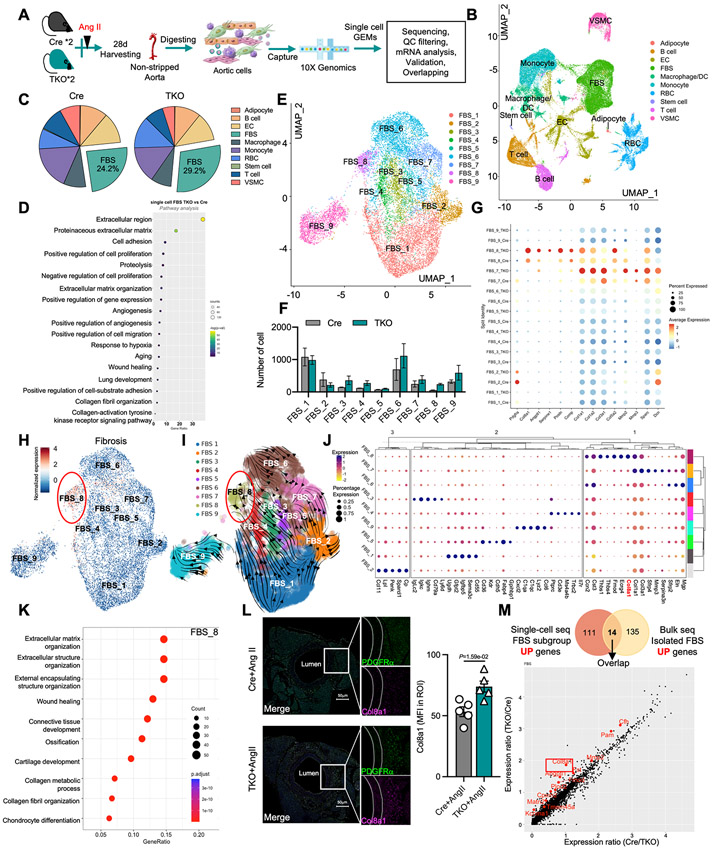
Figure 7. Single-cell RNA sequencing revealed fibroblast heterogeneity and activation signatures induced in TKO aortas.
A, Schematic diagram of aortic cells isolated from Ang II-treated Cre or TKO mice for single-cell RNA sequencing. B, Uniform Manifold Approximation and Projection (UMAP) of different aortic cell types. C, the percentage of different aortic cell types. D, IPA pathway analysis using total differentially expressed genes in fibroblasts. E, UMAP of 9 main fibroblast cell clusters. F, the number of different fibroblast clusters in Ang II treated Cre and TKO mice. G, dot plot of fibroblast activation signature-related genes. H, the UMAP of fibrosis genes by using add module score analysis. I, Velocity vector field displayed over the FBS UMAP. J, K-means cluster analysis for each fibroblast subclusters. K, Pathway analysis using the specific genes enriched in FBS_8. L, Representative immunofluorescence images of PDGFRα and Col8a1 in aorta (n=5, scale bars= 50μm). M, Overlapping upregulated genes from the indicated single-cell RNA seq dataset and isolated fibroblast bulk-RNA seq datasets (top); the overlapping increased genes from single-cell RNA seq (bottom). L, P values correspond to an unpaired two-tailed Mann-Whitney U-test. DC indicates dendritic cells; FBS, fibroblasts; EC, endothelial cells; RBC, red blood cells; VSMC, vascular smooth muscle cells; Ang II, angiotensin II.

