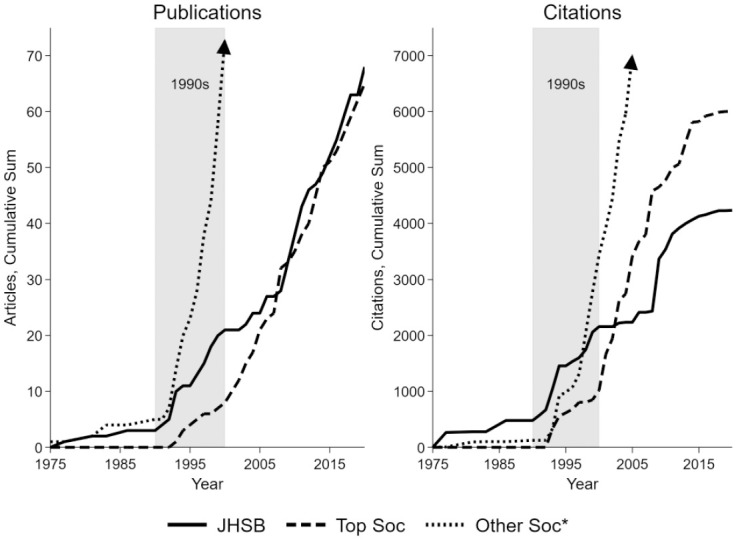
Figure 3.

Trends in Number of Publications and Citations to Articles Published in Each Year by Three Categories of Sociology Journals.
Note: “Other Soc*” capped at year 2000 value in publications and at year 2005 value in citations to maintain scale. This figure shows trends in the cumulative number of articles published on social networks and health articles (left panel) and citations to social networks and health articles published in given years according to Web of Science for articles published in three categories of sociology journals: Journal of Health and Social Behavior (JHSB); American Journal of Sociology, American Sociological Review, or Social Forces (Top Soc); or all other journals Web of Science indexes in its sociology category (Other Soc). The left panel counts articles, where the cumulative sum increases each year by the number of articles published on social networks and health in that journal in that year. The right panel shows the cumulative sum of citations to articles published in each of the journal categories as of 2020 (e.g., by 2020, there had been just over 4,000 citations to social networks and health articles published in JHSB).
