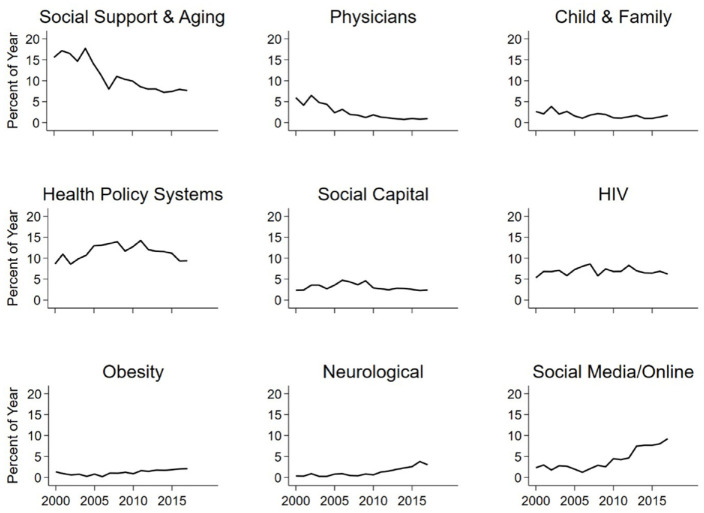
Figure 6.
Publication Volume Trends in Social Networks and Health Since 2000.
Note: This figure shows the percentage of articles published in each of the nine largest substantive areas defined via the clusters in Figures 4 and 5 in each year, allowing us to track the growth and decline of core topics in social networks and health. Within each year, the sum of all topics add to 100%, although these nine largest topics overall do not; smaller topics comprise the remainder.

