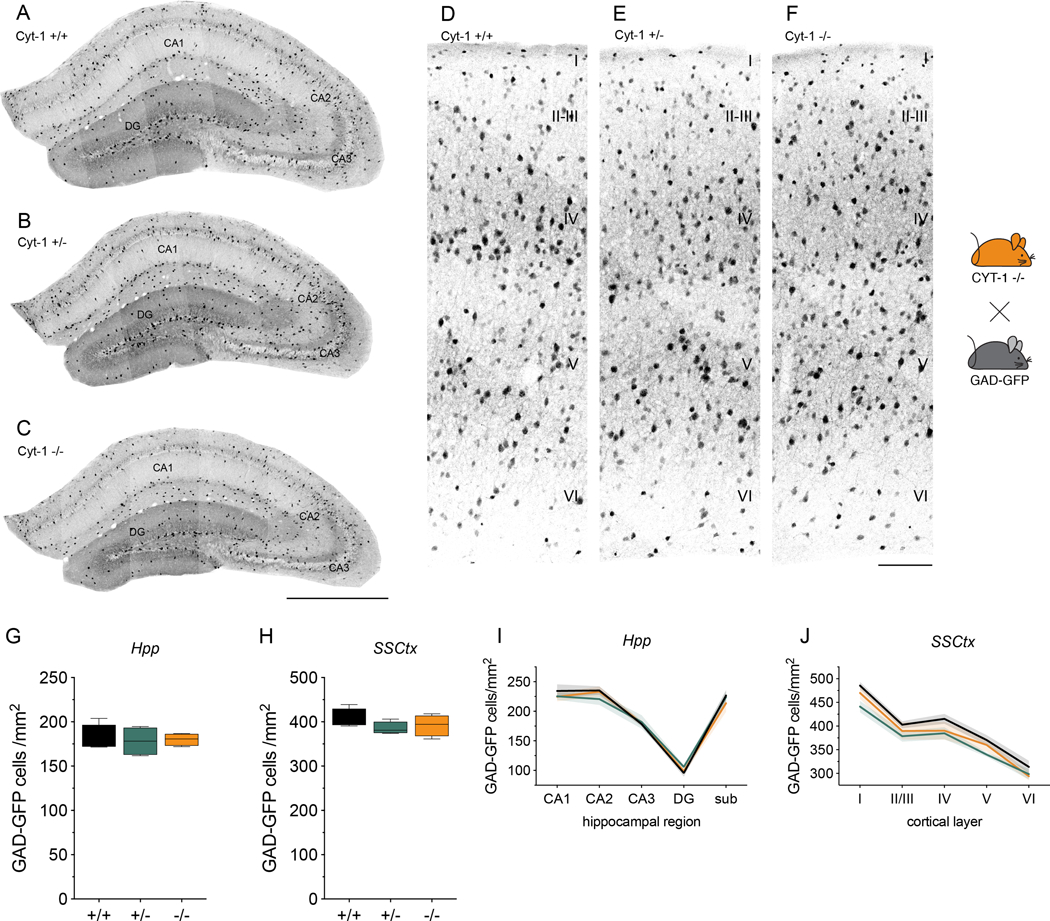
Figure 3. GABAergic interneurons in the hippocampus and primary somatosensory cortex are unaltered in Cyt-1 mutant mice.

Representative images of GFP-expressing GABAergic interneurons in the (A-C) dorsal hippocampus and (D-F) primary somatosensory cortex of control (A,D), Cyt-1 heterozygote (B,E), and KO (C,F) adolescent mice (P30). GABAergic neurons were labeled by breeding ErbB4 Cyt-1 KOs to transgenic GAD67-GFP mice (see Methods). Quantification of GFP-labelled GABAergic interneurons/mm2 in the (G) hippocampus (genotypes +/+: 180.8 ± 7.73, +/−: 178.1 ± 8.21 and −/−: 180.1 ± 3.54 cells/mm2; n=4, Kruskal-Wallis test, p=0.9410) and (H) in SSCtx (genotypes +/+: 407.7 ± 10.71, +/−: 385.5 ± 7.10 and −/−: 392.0 ± 11.99 cells/mm2; n=4, one-way ANOVA F(2,9)=1.264, p=0.3283). I,J) Graphs showing (I) the Hpp subregional and (J) SSCtx layer-specific distribution of GFP-labeled GABAergic interneurons in ErbB4 Cyt-1 KO (orange), heterozygote (green) and control (black) mice (n=4; two-way ANOVA). Scale bars 500 μm in C, 100 μm in F. DG, dentate gyrus; sub, subiculum; CA1-CA3, cornu ammonis regions.
