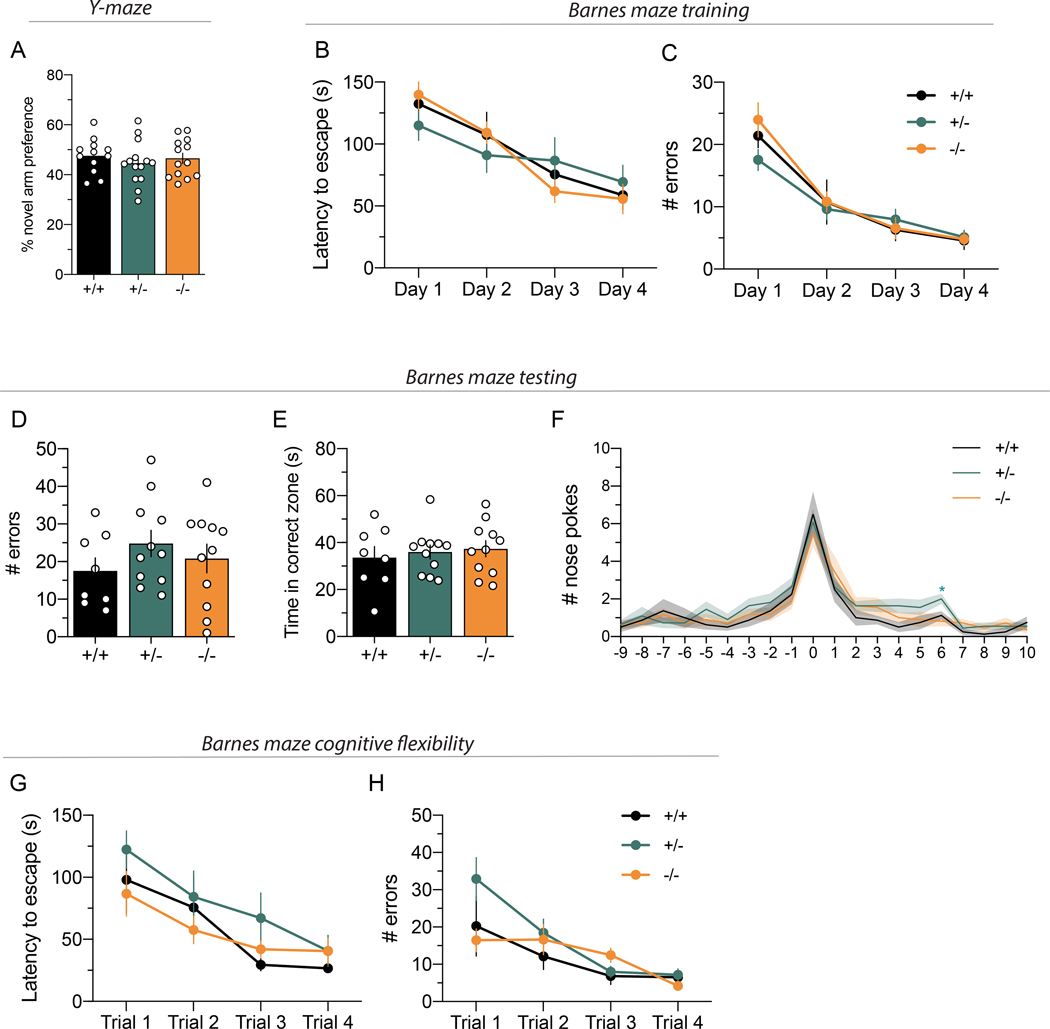
Figure 6. Cyt-1 mutant mice have normal working and reference memory, and cognitive flexibility.
(A) Working memory, plotted as percentage for novel arm preference in the Y-maze, is normal in Cyt-1 mutant mice (−/−; orange) compared to heterozygote (+/−; green) and wildtype (+/+; black) littermates (n=12–14/genotype, % alternation +/+ 47.58 ± 2.00%, +/− 44.66 ± 2.32%, +/+ 46.54 ± 2.12%, one-way ANOVA, F(2,36)=0.4677 p=0.6302). (B-G) Spatial reference memory of Cyt-1 KO mice in the Barnes maze is comparable to heterozygote and wild-type littermates during (B,C) initial training over four days, (D-F) testing on day five (n=8–11/genotype) and (G) adaption to a new target location. (B) Latency to escape during training (n=8–11/genotype, two-way ANOVA, F(6,81)=1.580, p=0.1635). (C) Number of errors committed during training (n=8–11/genotype, mixed-effects analysis, F(6,80)=1.158, p=0.3373). (D) Number of errors during testing (+/+: 17.5 ± 3.5, +/−: 24.8 ± 3.5, −/−: 20.8 ± 3.8, one-way ANOVA, F(2,27)=0.9498, p=0.3994). (E) Time spent in the correct quadrant/zone during testing (+/+ 33.6 ± 4.7 s, +/− 36.0 ± 3.0 s, −/− 37.4 ± 3.4 s, one-way ANOVA, F(2,27)=0.2508, p=0.7799). (F) Nose pokes in individual holes during testing (0 – target, 10 – opposite; two-way ANOVA (no outlier exclusion), F(38,513)=0.8407, p=0.7396, Tukey’s multiple comparisons test main column effect, +/+ vs. +/− p=0.1450, +/+ vs. −/− p=0.8096, +/− vs. −/− p=0.3263) (G) Latency to escape (n=8–11/genotype, mixed-effects analysis, F(6,79)=0.5949, p=0.7335, 2 outlier values) and (H) number of errors after moving target to a new position (cognitive flexibility; n=8–11/genotype, mixed-effects analysis, F(6,78)=1.906, p=0.0903, 3 outlier values removed).

