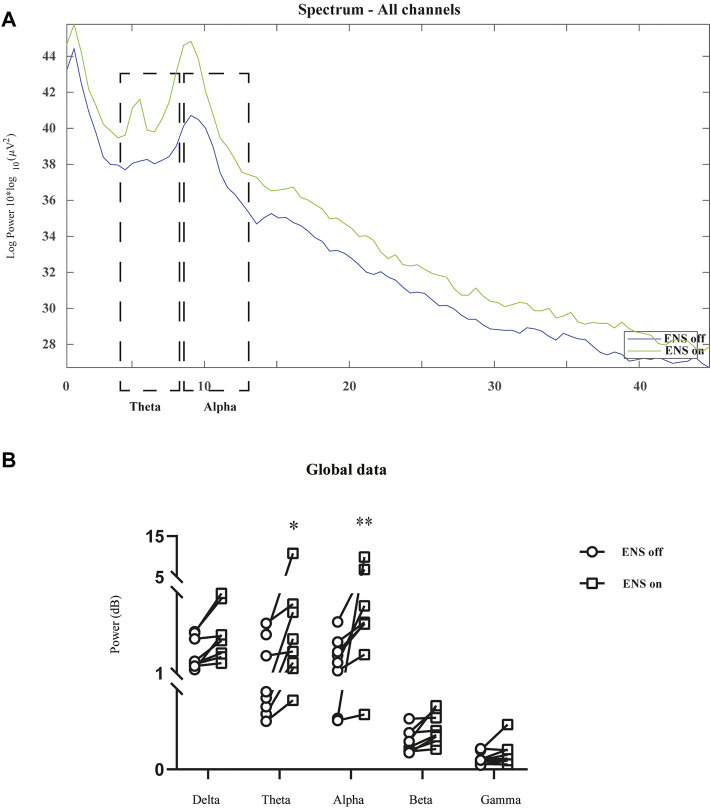
FIGURE 5.
Comparison of neural oscillations between neuromodulation conditions using resting-state EEG recordings. (A) Grand average spectral power during resting-state (blue line) and active ENS (green line). (B) Significant enhancement of oscillatory activity was observed in the theta and alpha bands, tested using a repeated-measures two-way ANOVA with post hoc Bonferroni tests. *p < 0.05; **p < 0.01.

