
FIGURE 6.
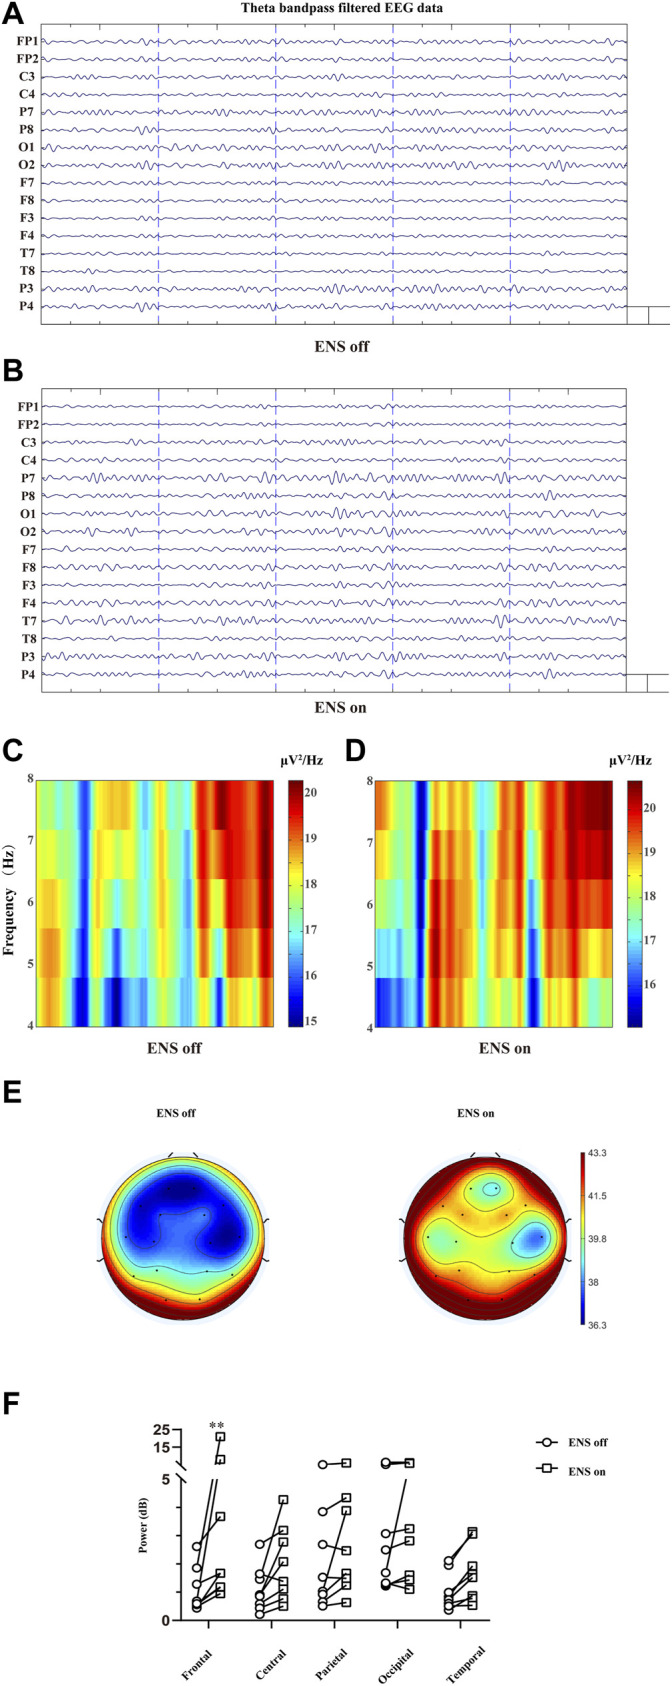
Cortical effect of ENS on theta activity. (A,B) Multiple-channel EEG data with theta band filtered at baseline and ENS activation. Representation of time–frequency domain spectrogram (4–8 Hz) at baseline (C) and ENS therapy (D). (E) Topographic power spectral density maps in the theta (4–8 Hz) frequency band. (F) Theta oscillations increased significantly in the frontal region, tested using a repeated-measures two-way ANOVA with post hoc Bonferroni tests. *p < 0.05.