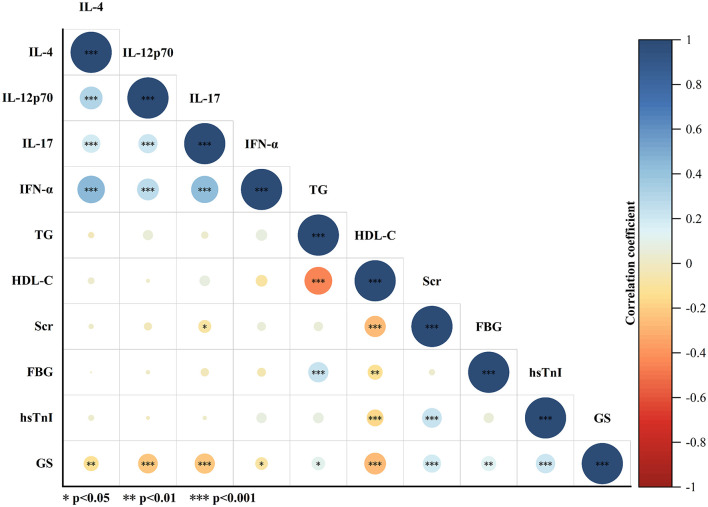
Figure 2.
Pearson correlation analysis of variables with statistically significant difference between non-severe CAD group and severe CAD group. The area and color of the circle represent the value of the correlation coefficient. The larger the area of the circle, the larger the absolute value of the correlation coefficient; the color of the circle corresponds to the value of the correlation coefficient on the color scale. *P < 0.05, **P < 0.01, ***P < 0.001.

