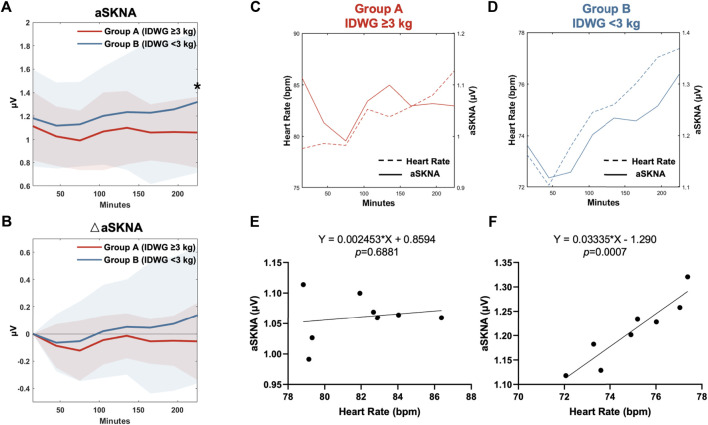
FIGURE 3.
HR-aSKNA correlation between Group A (IDWG≥3 kg) and Group B (<3 kg). (A,B) Subgroup analysis showed aSKNA (A) and the difference of aSKNA to the baseline in 0–30 min (△aSKNA) (B). The aSKNA in 210–240 min was significantly higher in Group B (IDWG <3 kg). “*” stands for statistically significant (p < 0.05) by Student’s t test between two subgroups. (C,D) The relationship of HR and aSKNA in Group A (C) or Group B (D) was demonstrated in eight periods (0–30, 30–60, 60–90, 90–120, 120–150, 150–180, 180–210, 210–240 min). (E,F) There was no HR-aSKNA correlation observed in patients in Group A (E, p = 0.688). Instead, a linear correlation was found in Group B (F, p < 0.001).

