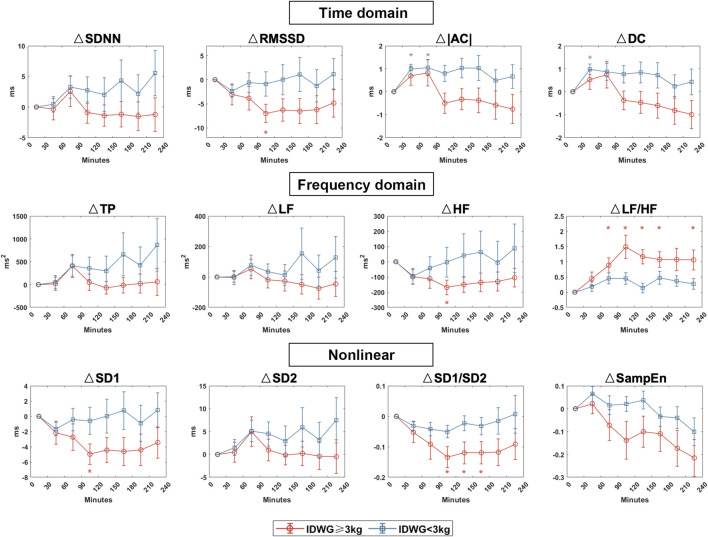
FIGURE 5.
HRV dynamic changes in Group A (IDWG≥3 kg) and Group B (IDWG<3 kg). Changes in the time domain (SDNN, RMSSD, |AC|, DC), frequency domain (TP, LF, HF, LF/HF), and nonlinear (SD1, SD2, SD1/SD2, SampEn) measurement of HRV compared with 0–30 min in two subgroups. Red and blue lines or “*” stand for IDWG≥3 kg and IDWG<3 kg, respectively. “△” stands for the difference compared to the baseline. “*” stands for statistically significant (p < 0.05) by one-way repeated measures ANOVA adjusted by Bonferroni’s multiple comparisons tests (vs the baseline in 0–30 min). Error bars stand for the standard error of the mean (SEM).

