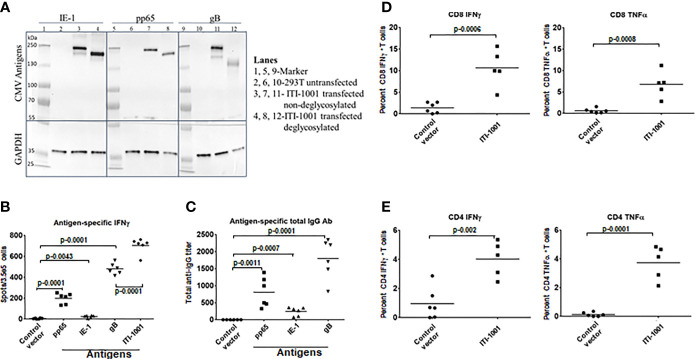
Figure 1.
Expression and immunological response of ITI-1001 vaccine. (A) Western blots showing the expression of IE-1, pp65, and gB HCMV antigens from ITI-1001 in 293T cell lysates using antigen-specific antibodies. Lanes 2, 6, and 10 are untransfected cell lysates. Lanes 3, 7, and 11 are ITI-1001-transfected non-deglycosylated cell lysates. Lanes 4, 8, and 12 are ITI-1001-transfected deglycosylated cell lysates. Glyceraldehyde 3-phosphate dehydrogenase was used as a loading control. Molecular weight ladder was used in lanes 1, 5, and 9 to assist in protein size determination. (B) IFNγ ELISpot data with antigen-specific peptides for pp65, IE-1, and gB and all three antigens combined using splenocytes. p values from Student’s t-test are denoted to signify the statistical differences between the groups. (C) Serum-based Enzyme linked immunosorbent assay for antigen-specific total antibody detection. p values from Student’s t-test are denoted to signify the statistical differences between the groups. (D, E) Flow cytometric analysis of CD8 and CD4 T cells respectively for antigen-specific activation and intracellular cytokine staining for IFNγ and TNFα. The percent T cells in each graph are from T effector memory cell populations (CD44+ CD62-) for CD4 and CD8 T cells. p values from Student’s t-test are denoted to signify the statistical differences between the groups.

