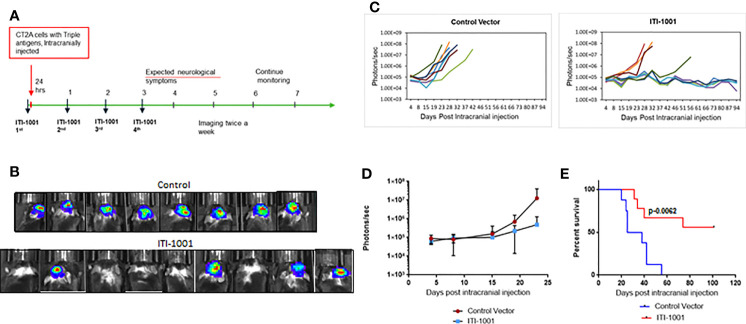
Figure 2.
ITI-1001 confers survival benefit in an orthotopic syngeneic GBM mouse model. (A) Schedule for efficacy study with intracranial injection, vaccinations, and imaging information. (B) Representative bioluminescence images of mice injected with CT2A cells expressing the three human cytomegalo virus antigens in control and ITI-1001-treated group and the maximum signal shown by each mouse. (C) Tumor growth kinetics plotted using bioluminescence signal and the days post intracranial injection for control and ITI-1001 group. (D) Average bioluminescence is shown in the third plot for the time points where all the mice were alive. (E) Survival curve for control and ITI-1001-treated group plotted with percent survival and days post intracranial injection. Control group (n = 8) had a median survival of 31.5 days, and ITI-1001 (n = 9) median survival could not be calculated due to insufficient deaths. p value (0.0062) from log-rank (Mantel–Cox) test denotes the statistical difference between the two curves. The percent survival was 56%.

