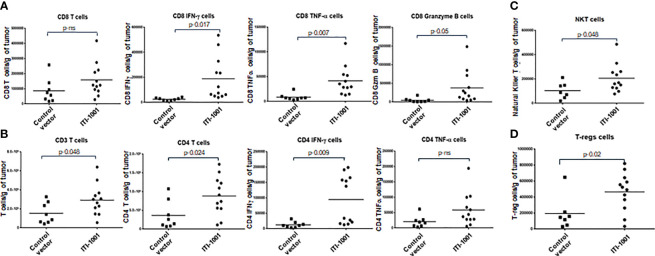
Figure 3.
ITI-1001 activates CD4, CD8, and NK T cells in the tumor microenvironment (TME) along with immunosuppressive regulatory T cells. (A) Flow cytometric data for total and activated CD8 T cells in the TME with and without ITI-1001 vaccination. For CD8 T-cell activation, intracellular staining of IFNγ, TNFα, and granzyme B are shown. (B) Flow cytometry data for total T cells and total and activated CD4 T cells in the TME with and without ITI-1001 vaccination. For CD4 T-cell activation, intracellular staining of IFNγ and TNFα is shown. (C, D) Flow cytometry data showing natural killer T cells and Tregs respectively in the TME from the two groups. All the populations are denoted as cell numbers per gram of tumor. p values from Student’s t-test are denoted to signify the statistical differences between the control and treated tumors.

