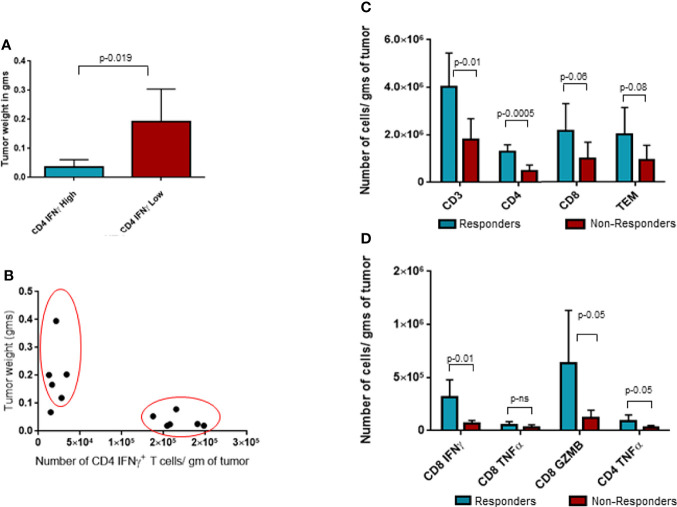
Figure 5.
Analysis of responders and non-responders based on CD4 Interferonγ expression levels. (A) Tumor weight data in grams for two groups of ITI-1001-treated tumors based on the two populations of CD4 Interferonγ high and low levels observed in Figure 3B . (B) Unbiased correlation plot between tumor weight and CD4 Interferonγ+ samples. Correlation coefficient r-(-0.71). (C) Evaluating the differences between the responders and non-responders for T-cell population. (D) Evaluating the differences between the responders and non-responders for activated CD8 and CD4 T cells using IFNγ+ and TNFα+ expression. All the populations are denoted as cell numbers per gram of tumor. p values from Student’s t-test are denoted to signify the statistical differences between responders and non-responders.

