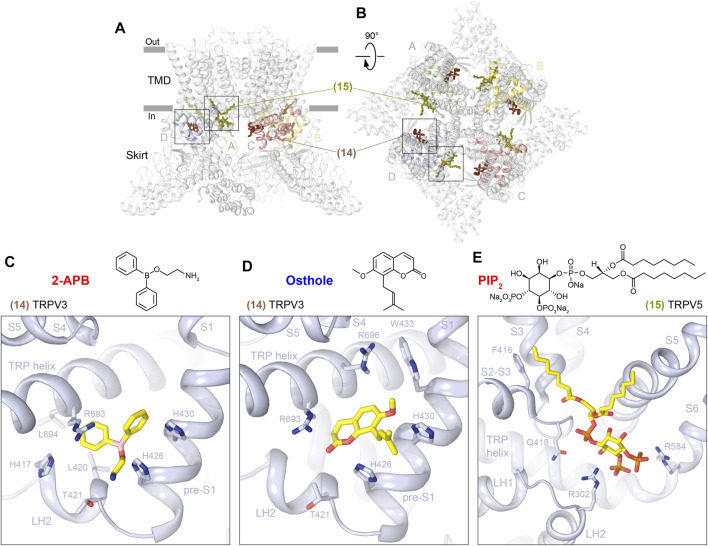
FIGURE 7.
ARD–TMD interface sites. (A–B) Side (A) and top (B) views of the TRPV1 tetramer (gray; PDB ID: 7LQY) with the ARD-TMD linker (14) and S2-S3 (15) sites illustrated by ligands in brown and olive, respectively. Rectangles indicate the regions expanded in close-up views. (C–E) Close-up views of the ARD-TMD linker site in TRPV3 with bound 2-APB (C, PDB ID: 6DVZ) or osthole (D, PDB ID: 7RAS) and the S2-S3 site in TRPV5 with bound PIP2 (E, PDB ID: 6DMU). Residues contributing to ligand binding are shown in sticks. The chemical structures of the corresponding ligands are shown above the close-up views.

