
FIGURE 1.
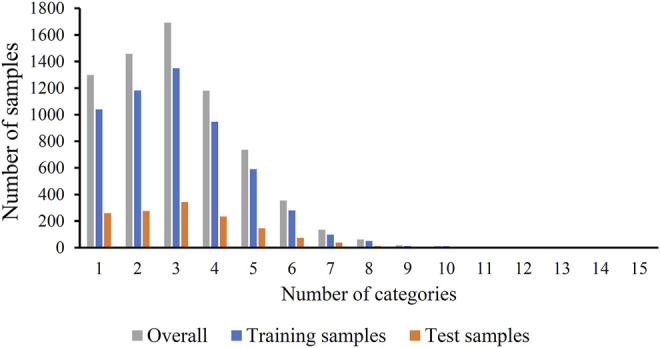
Distribution of training, test and overall samples based on the number of categories that they belong to. Several samples belong to two or more categories.
Official websites use .gov
A
.gov website belongs to an official
government organization in the United States.
Secure .gov websites use HTTPS
A lock (
) or https:// means you've safely
connected to the .gov website. Share sensitive
information only on official, secure websites.
Distribution of training, test and overall samples based on the number of categories that they belong to. Several samples belong to two or more categories.