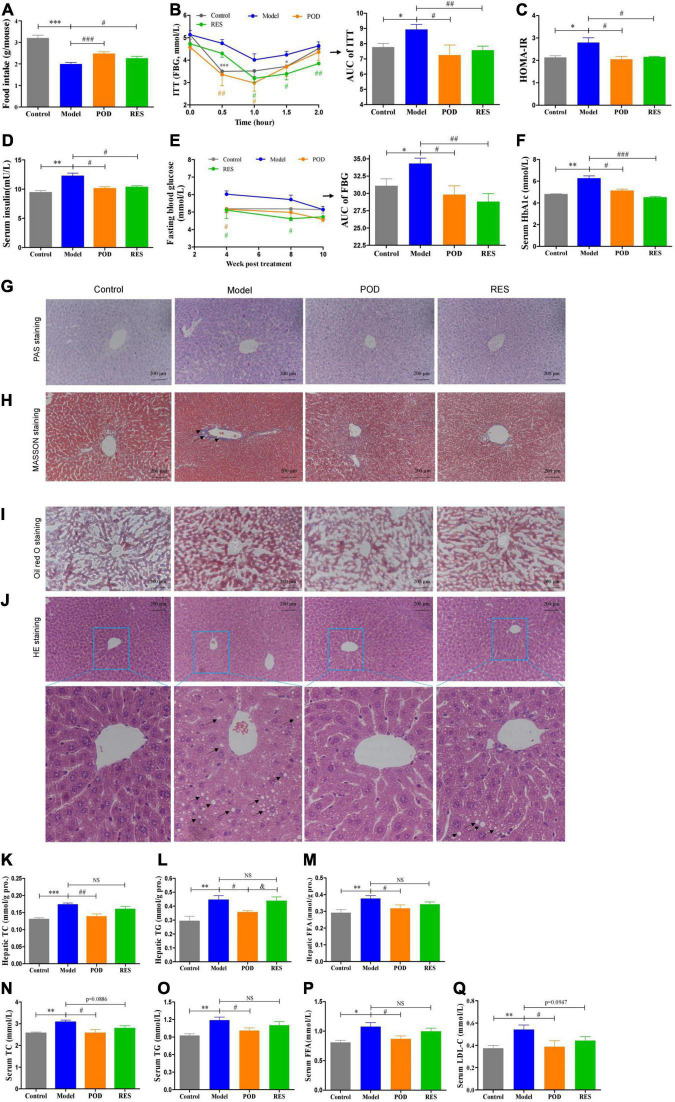
FIGURE 3.
Effects of POD and RES on glucolipid metabolism and fatty liver. (A) Food intake. (B) Insulin tolerance test (ITT) and the area under the curve (AUC). (C) Homeostasis model assessment -insulin resistance (HOMR-IR, HOMA-IR = Glucose [mmol/L] × Insulin [mU/L] ÷ 22.5). (D) Serum insulin level. (E) Fasting blood glucose level (FBG) and AUC of FBG. (F) Serum HbA1c level. (G–J) Hepatic periodic acid-schiff (PAS) (200×), MASSON (200×), Oil red O (200×), and HE stainings (200×), respectively. (K–M) Total cholesterol (TC), triglycerides (TG), and free fatty acid (FFA) in liver, respectively. (N–Q) Serum levels of TC, TG, FFA, and low-density lipoprotein-cholesterol (LDL-C), respectively. Data are presented as mean ± SEM. * p < 0.05, ** p < 0.01, *** p < 0.001. # p < 0.05, ## p < 0.01, ### p < 0.001, compared to model group. & p < 0.05, compared to POD group. NS, p > 0.05.

