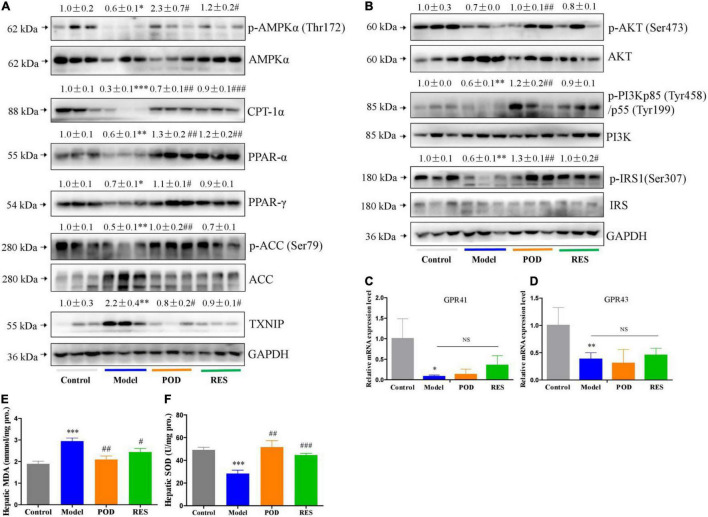
FIGURE 4.
Effects of POD and RES on AMPK signaling pathway and biomarkers of oxidative stress in liver. (A) AMPK signaling pathway proteins. (B) Insulin signaling pathway proteins. (C,D) The mRNA levels of GPR41 and GPR43. (E) MDA level. (F) SOD enzyme activity level. Data are presented as mean ± SEM. * p < 0.05, ** p < 0.01, *** p < 0.001, compared to control group. # p < 0.05, ## p < 0.01, ### p < 0.001, compared to model group. NS, p > 0.05.

