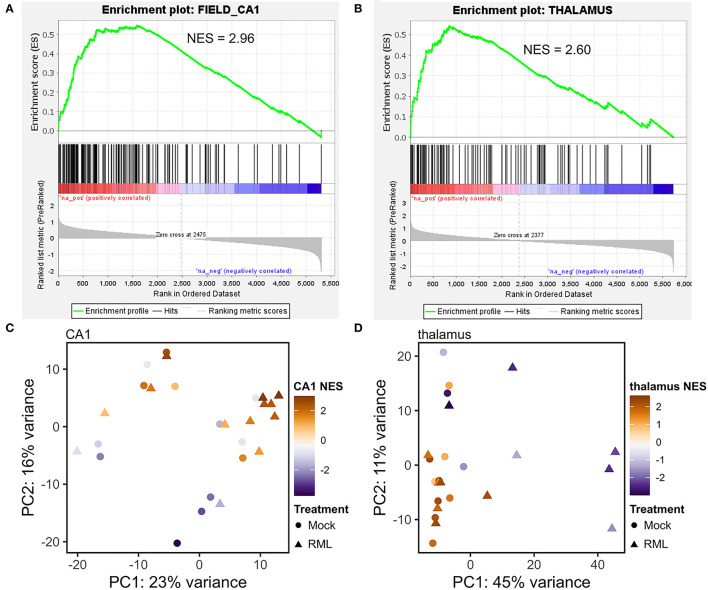
Figure 2.
Enrichment with known gene expression profiles from the Allen brain atlas correlates with principle component analysis of microdissected CA1 and thalamus tissues. Gene expression in each microdissected sample from the CA1 or thalamus was ranked based on relative abundance and supplied to GSEA for pre-ranked gene set enrichment analysis against a database of known brain-region enriched genes obtained from the Allen brain atlas. Representative enrichment plots are shown for the CA1 (A) and thalamus (B). Normalized enrichment scores (NES) for either the Allen brain atlas “CA1” or “thalamus” gene sets were found to correlate with principle component analysis of gene expression in microdissected tissues from the CA1 (C) and thalamus (D).

