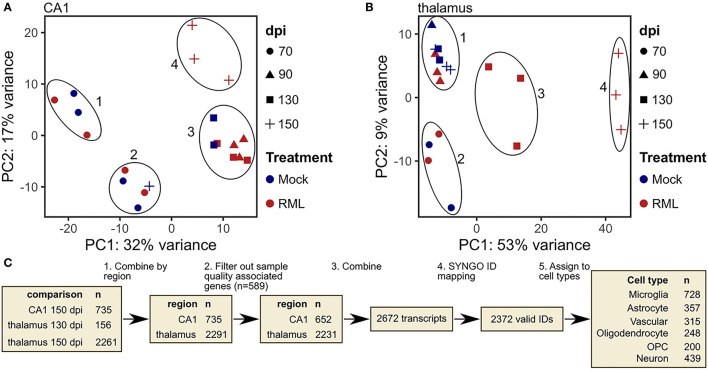
Figure 3.
Identification of transcripts with altered abundance in microdissected CA1 and thalamus tissues from RML infected mice. (A) Principle component analysis (PCA) plot of microdissected CA1 tissues used for differential expression analysis with color mapped to treatment and shape indicating days post infection (dpi). (B) PCA plot of microdissected thalamus tissues used for differential expression analysis with color mapped to treatment and shape indicating dpi. (C) Schematic representation of workflow used to identify prion altered transcripts and classify them based on brain cell type.

